BP Stock Gains 5.44%, Testing Key Resistance In Focus
On September 25, 2026: price 571.80 GBp, trend uptrend, RSI 55.0, support 514.50, resistance 580.30. technical analysis of bp stock. BP Stock Gains — full…

BP plc is trading near the top of its recent range, but the message from momentum is less convincing than the price alone suggests. The shares were last at 571.80 GBp on the LSE, up 5.44% on the day and 8.17% over one month, according to exchange-linked data via Yahoo Finance. That puts the stock close to a short-term ceiling rather than at a clean breakout point.
Trend & Price Action
The chart shows a stock that is still in an uptrend, with the price trading above the SMA20 at 549.13 and also above the SMA50 at 538.66. That matters because it means the market is still accepting higher prices on average, even after a recent pause. The SMA20 slope of 0.57% over 5 days also points to a rising short-term trend rather than a flat one.
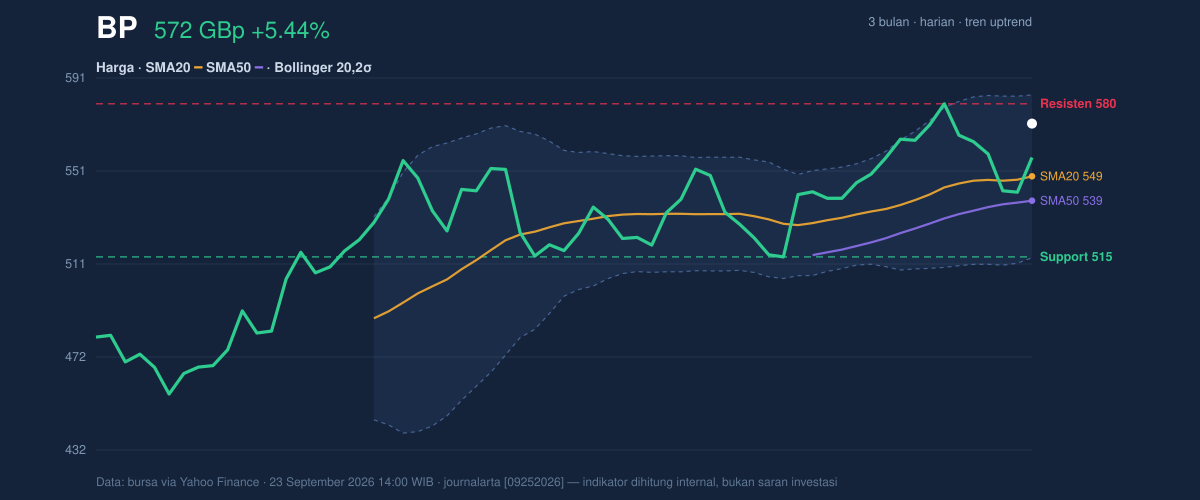
What is more important is where the shares sit inside the range. BP is at 87% of its 20-hour range, with support at 514.50 and resistance at 580.30. In plain terms, the stock is closer to the upper boundary than the lower one, so the market has already priced in much of the latest strength. The 3-month high is 582.60, which puts the current price just below a level that has recently capped advances. That proximity often matters because traders tend to watch prior highs for signs of either continuation or rejection.
The Bollinger Bands reinforce that picture. The middle band sits at 549.13, the upper band at 584.11, and the lower band at 514.14. With price near the upper band and %B at 82%, BP is trading in the upper part of its recent volatility envelope. This usually signals strength, but it can also mean the move is getting extended unless fresh demand appears.
Oscillators & Momentum
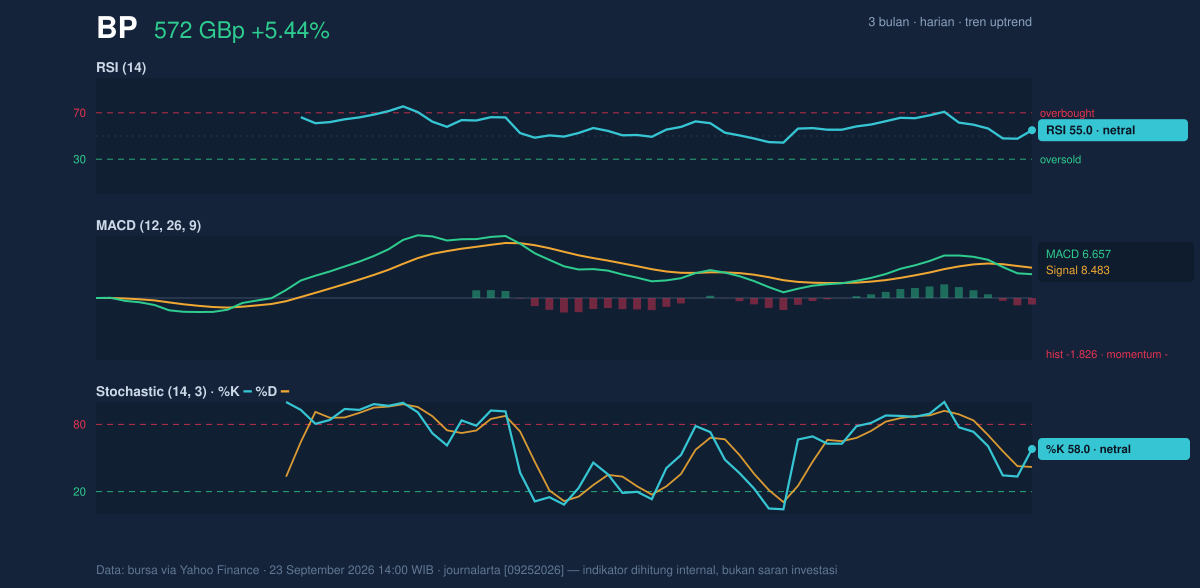
Momentum is where the story becomes more cautious. The RSI at 55.0 is neutral, which means the stock is not stretched enough to suggest an overbought condition, but it is also not showing strong momentum leadership. The Stochastic %K at 58.0 and %D at 42.0 is similarly neutral-to-firm, implying some upward pressure without a decisive breakout signal.
The more important warning comes from the MACD. The MACD at 6.657 is below the signal line at 8.483, leaving a negative histogram of -1.826. That combination means the recent rally is still intact on price, but the internal pace of that rally has slowed. In technical terms, price is holding up better than momentum, which can happen before consolidation or a failed push through resistance.
That divergence is also consistent with the volume picture. Last volume was 43,313,868, below the 20-hour average of 47,821,265, or 0.9× normal. A rally on lighter participation is not automatically weak, but it does suggest the latest move has not yet won broad conviction. The OBV is falling, which means cumulative volume flow is not confirming the price strength. When price rises while OBV falls, the market is saying the advance may be running ahead of participation.
Volatility & Volume
Volatility is moderate rather than explosive. The ATR(14) of 16.55 equals 2.9% of price, so the stock can still move meaningfully in a day, but not in a disorderly way. Bollinger bandwidth is 12.7%, described as normal, which suggests the market is not in a volatility squeeze that would often precede a sharp expansion. Instead, BP looks like it is moving within a fairly standard range, with the upper band and resistance zone acting as the immediate test.
That matters because the current setup is not a clean trend acceleration. It is a mature short-term rise that is now testing whether buyers can carry it beyond the recent high area. If volume improves and MACD turns back up, the price has room to challenge the upper band. If not, the stock may drift back toward the middle band at 549.13 or the lower part of the range.
Key Levels & Scenarios
The first level to watch is 580.30, the current resistance. A decisive move above that area would put the 582.60 three-month high in play and would show that the market is willing to pay up beyond the recent ceiling. The next support sits at 549.13, which is also the Bollinger midline and the SMA20, making it the most important trend gauge on the chart. Below that, 514.50 and 514.14 form the lower support zone where buyers previously stepped in.
If BP fails to hold the mid-band area, the chart would shift from bullish consolidation to a more defensive posture. If it breaks above resistance, the message would be that the recent pause was only a rest, not a reversal.
Technical Verdict: HOLD (wait & see)
HOLD (wait & see) is the cleanest technical read because price is still in an uptrend, but momentum and participation are not fully confirming the move.
- Price is above the SMA20 and SMA50, which keeps the trend constructive.
- MACD is negative versus its signal line, showing momentum has weakened even as price stays elevated.
- OBV is falling and volume is below average, which means the latest rise lacks strong confirmation.
Verdict invalidated if price falls below 514.50, because that would break the nearest support zone and undermine the current trend structure.
- Ideal entry range: 549.13 to 514.50
- Exit target: 580.30 to 582.60
- Stop loss protection: below 514.14
In plain English: BP is still holding its upward shape, but the market has not yet shown enough force to prove the latest rise can extend cleanly through resistance.
Summary Data BP
| Last price | 571.80 GBp |
| Change 1 day / 5 days / 1 month | 5.44% / 0.88% / 8.17% |
| Trend / MA-cross | uptrend / none |
| SMA20 / SMA50 | 549.13 / 538.66 |
| RSI (14) / Stochastic %K | 55.0 / 58.0 |
| Bollinger %B / ATR | 82% / 16.55 |
| Support / Resistance 20 days | 514.50 / 580.30 |
| Data as of | 23 September 2026 14:00 WIB |



