BP Stock Drops 2.33% Today, Momentum Weakens
On September 28, 2026: price 558.50 GBp, trend uptrend, RSI 54.0, support 514.50, resistance 580.30. technical analysis of bp stock. BP Stock Drops — full…

BP plc is holding above its short-term trend line, but the tape is sending mixed signals: the shares are still in an uptrend, yet momentum has cooled and volume is not confirming a clean breakout.
BP’s London-listed shares last changed hands at 558.50 GBp on 25 September 2026 at 14:00 WIB, according to Yahoo Finance data sourced from the exchange, after slipping 2.33% on the day. That pullback matters less for the size of the move than for where it happened: the stock remains above its SMA20 at 553.73 and SMA50 at 540.91, which keeps the broader technical structure constructive. The key question is whether this is a routine pause inside the trend, or the start of a deeper fade from the recent high area.
Trend & Price Action
The chart shows BP still trading in an uptrend, with the SMA20 rising 1.12% over the past 5 days. That slope is important because it signals that short-term buyers have been willing to lift the average price, even if the latest session was softer. Price sitting above both moving averages also means the market has not yet lost its medium-term footing.
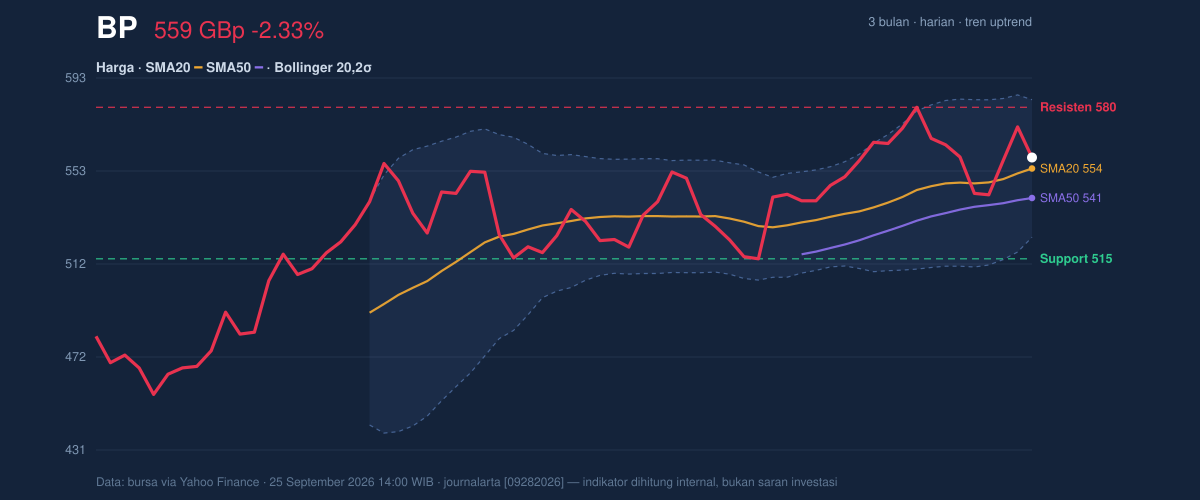
The shares are also positioned in the upper half of the recent trading band. BP sits at about 67% of the 20-hour range, with support at 514.50 and resistance at 580.30. That placement says the market is still closer to the ceiling than the floor, but not yet at the top of the Bollinger envelope. The stock’s 3-month high is 582.60, just above the current resistance zone, while the 3-month low is 450.60. In practical terms, the market is testing whether it can reclaim the recent peak area or whether the rally is simply tiring near that band.
The Bollinger structure is not stretched: the upper band is 583.60, the middle band is 553.73, and the lower band is 523.87. With price near the middle-to-upper portion of that envelope and the band width at 10.8%, volatility is still moderate rather than explosive. That usually points to a market that is digesting gains, not one already in panic or euphoria.
Oscillators & Momentum
The momentum picture is softer than the trend picture. BP’s RSI at 54.0 is neutral, which means the shares are neither overbought nor oversold. That is not a bearish reading by itself, but it does tell us the rally is no longer carrying strong upward momentum. The Stochastic %K at 60.2 and %D at 66.8 are also neutral, with no clear oversold rebound signal and no overbought warning either.
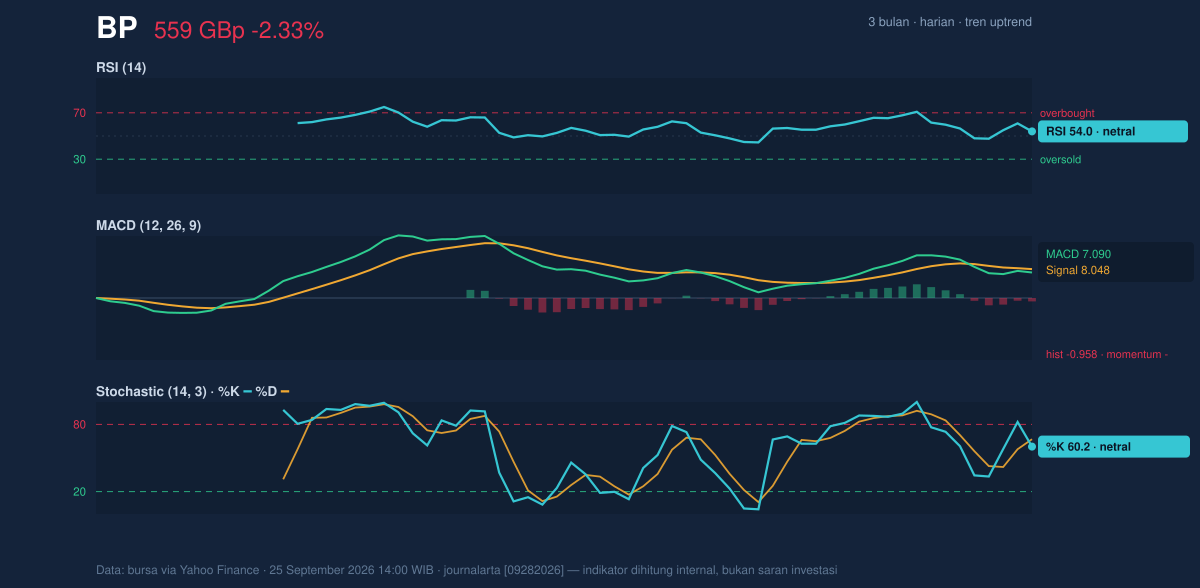
The more telling signal is the MACD at 7.090 versus the signal line at 8.048, leaving a histogram of -0.958. In plain English, that means the trend is still positive on the chart, but the pace of that trend has slowed and short-term momentum has slipped below its trigger line. When MACD is negative while price remains above key moving averages, it often signals consolidation rather than immediate reversal — but it also warns that buyers have not fully regained control.
Volatility & Volume
ATR, or average true range, stands at 17.21, equal to 3.1% of price. That points to moderate daily movement: enough room for meaningful swings, but not the kind of volatility that usually accompanies a disorderly break. The Bollinger width of 10.8% reinforces that view. This is a market with movement potential, but not yet a volatility expansion signal.
Volume is more interesting. The latest session printed 81,693,829 shares, versus a 20-day average of 49,538,317, or about 1.6x normal turnover. Heavy volume on a down day can mean two different things: either institutions are actively distributing stock, or the market is simply reacting to a catalyst with stronger participation. Here, the OBV is falling, which tilts the interpretation toward distribution rather than accumulation. In other words, the market is seeing plenty of activity, but the balance of that activity has not been helping price hold higher ground.
Key Levels & Scenarios
The immediate technical map is clear. Resistance at 580.30 sits just below the 3-month high of 582.60 and just under the upper Bollinger band at 583.60. That cluster is the first area where the market has to prove it can absorb supply. If BP can move through that zone, the chart would suggest the recent hesitation was only a pause.
On the downside, support at 553.73 matters because it is also the SMA20 and the Bollinger middle band. That makes it a pivot area rather than a simple line on a chart. A clean hold above it would keep the uptrend intact. If that level gives way, the next cushion sits at 523.87, the lower Bollinger band, with deeper structural support at 514.50.
The current setup therefore reads as a trend that is still alive, but no longer fully synchronized across indicators: price and moving averages are constructive, while MACD and OBV are less supportive.
Technical Verdict: HOLD (wait & see)
HOLD (wait & see)
- RSI at 54.0 and Stochastic at 60.2/66.8 are neutral, so momentum is not strong enough to justify a decisive directional call.
- Price above SMA20 and SMA50 keeps the trend positive, but MACD histogram at -0.958 shows momentum has weakened.
- Volume at 1.6x average with OBV falling suggests participation is high but not clearly supportive of further upside yet.
- Verdict invalidated if price breaks below 553.73, because that would mean the stock has lost both the SMA20 and the Bollinger middle line.
- Ideal entry range: 553.73 to 558.50
- Exit target: 580.30 to 583.60
- Stop loss protection: 523.87, with deeper structural protection at 514.50
For non-traders, this means BP is still technically holding up, but the chart is asking for proof before the next move higher.
Summary Data BP
| Last price | 558.50 GBp |
| Change 1 day / 5 days / 1 month | -2.33% / -0.04% / 8.36% |
| Trend / MA-cross | uptrend / none |
| SMA20 / SMA50 | 553.73 / 540.91 |
| RSI (14) / Stochastic %K | 54.0 / 60.2 |
| Bollinger %B / ATR | 58% / 17.21 |
| Support / Resistance 20 days | 514.50 / 580.30 |
| Data as of | 25 September 2026 14:00 WIB |


