Testing Key Resistance, DBS Stock Drops 0.64% Today
On Agustus 14, 2026: price 76.50 SGD, trend uptrend, RSI 66.7, support 71.90, resistance 76.99. technical analysis of dbs stock. Testing Key Resistance — full…

DBS Group ended at SGD 76.50, down 0.64% from the previous close of SGD 76.99, but the more important signal is that the share is still trading above its short- and medium-term trend markers. The stock sits above SMA20 at 74.07 and well above SMA50 at 69.22, which keeps the broader structure in an uptrend even after a modest pullback. What makes this move worth watching is not the day’s dip itself, but the fact that DBS is now pressing near the top of its recent range, where momentum often decides whether a rally keeps stretching or pauses for breath.
Trend & Price Action
As shown in the chart, DBS remains in an uptrend, with the SMA20 rising 1.73% over 5 days. That slope matters: a rising short-term average usually signals that buyers have been willing to pay progressively higher prices, even if the latest session was softer. The stock is also trading above both moving averages, which tells us the trend is still intact rather than merely bouncing inside a sideways band. There is no new MA-cross, so this is not a fresh breakout signal from the moving averages themselves; instead, it is an established trend that is being tested near resistance.
The price is also sitting at about 90% of the 20-hour range, with support at 71.90 and resistance at 76.99. That positioning is important because it shows DBS is already near the upper boundary of the range rather than in the middle where it has more room to drift. In plain terms, the market is telling us the stock is strong, but not cheap in the very short term.
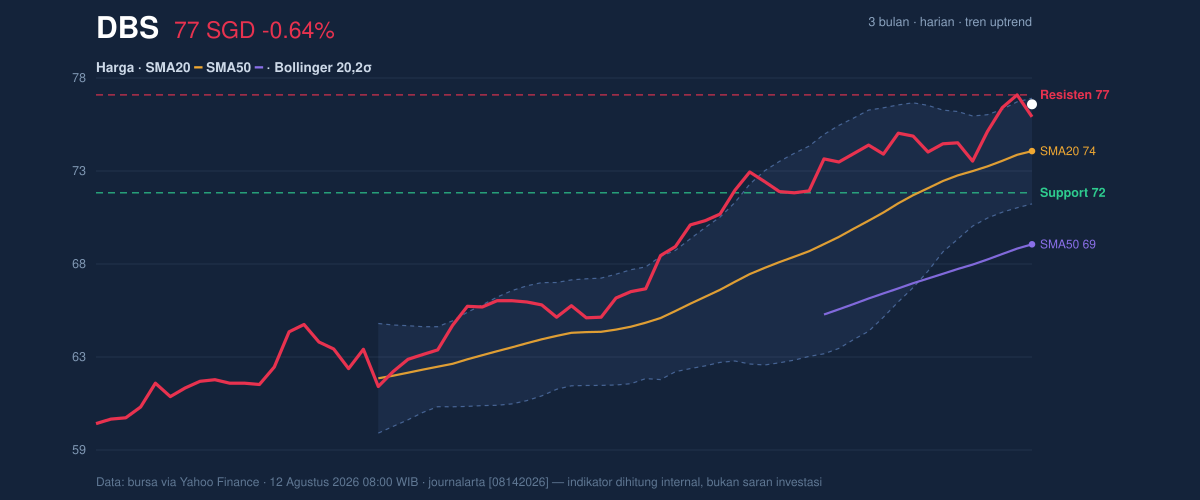
The broader context is constructive: DBS is only a fraction below its 3-month high of 77.97 and far above the 3-month low of 59.14. That spread suggests the market has already repriced the stock significantly, so the question now is whether buyers can absorb supply near the highs. If they cannot, price tends to rotate back toward the moving averages; if they can, the current range can widen upward.
Oscillators & Momentum
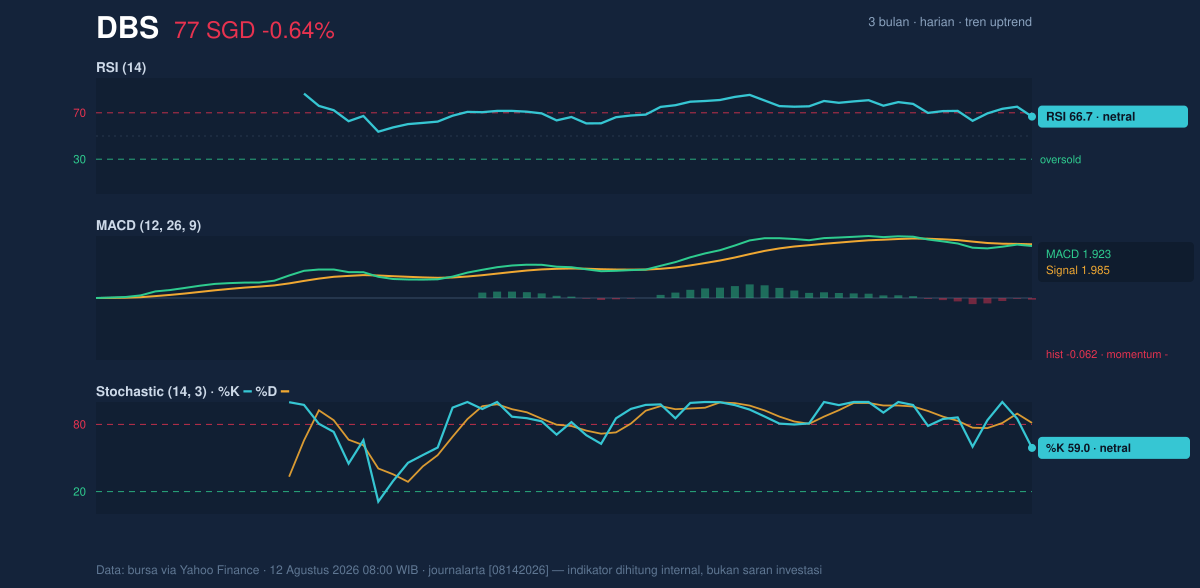
Momentum is less clean than the trend. RSI(14) at 66.7 is still neutral by the data provided, but it is close enough to the upper end of the scale to show the stock is not struggling for demand. The catch is in the faster indicators: Stochastic %K at 59.0 versus %D at 81.4 points to a softer short-term impulse, because the faster line is below the signal line. That often means the latest price advance has slowed, even if the broader trend remains intact. The message is not “trend broken”; it is “trend extended and pausing.”
MACD is the most cautionary signal here. MACD at 1.923 sits below the signal line at 1.985, and the histogram at -0.062 confirms momentum has turned slightly negative. In practical terms, MACD is saying the pace of the advance has cooled faster than price itself. That divergence matters because a stock can stay above trend support for a while even as momentum fades, but the longer that persists, the more likely price is to consolidate rather than accelerate.
Volatility & Volume
Volatility is not especially wide, but it is tightening in a way that can matter soon. The Bollinger band width of 7.4% is described as a squeeze, which usually means the market has compressed into a narrower trading zone and may be preparing for a larger move. The upper band sits at 76.81, almost exactly where price is now, while the middle band is 74.07 and the lower band is 71.32. With %B at 94%, DBS is trading very close to the top of its Bollinger envelope. That is a strong-location signal, but it also warns that upside room may be limited unless the stock can decisively clear the ceiling.
ATR(14) at 1.24, or 1.6% of price, suggests daily movement remains moderate rather than explosive. Volume adds a useful layer of confirmation: the latest print of 5,129,600 shares is almost exactly in line with the 20-day average of 5,065,712, so the move is being supported by normal participation, not a one-off surge. OBV is rising, which means volume flow has generally favored accumulation even if the last session softened. That combination — steady volume, rising OBV, and a squeeze — often precedes a directional decision rather than a quiet drift.
Key Levels & Scenarios
Resistance at 76.99 is the first level that matters because it lines up closely with the recent high and the upper Bollinger band at 76.81. If DBS can move through that zone, the chart would be signaling that buyers have absorbed near-term supply and are willing to pay above the recent ceiling. On the other hand, support at 71.90 and the Bollinger middle band at 74.07 are the first cushions if momentum continues to fade. A slip below those levels would suggest the stock is reverting from the top of its range back toward its trend base.
In other words, the chart is balanced on a narrow ledge: price is strong enough to stay in an uptrend, but momentum is not yet strong enough to confirm a clean breakout. That is why the next move matters more than the last one.
Technical Verdict: HOLD (wait & see)
HOLD (wait & see) fits best because the trend remains positive, but momentum has softened at an important resistance zone.
- Reason 1: Price is above SMA20 and SMA50, keeping the broader uptrend intact.
- Reason 2: MACD is below its signal line and the histogram is negative, showing fading short-term momentum.
- Reason 3: %B at 94% and price near 76.99 resistance indicate the stock is stretched toward the top of its range.
Verdict invalidated if price breaks below 71.90, which would weaken the current structure and pull the stock back toward the lower Bollinger band at 71.32.
- Ideal Entry Range: 74.07 to 71.90
- Exit Target: 76.99 to 77.97
- Stop Loss protection: below 71.90
For non-traders, this means DBS still looks structurally firm, but the chart is asking for confirmation before the next leg higher.
“The market is strong, but it is now asking the same question every late-stage rally faces: can buyers still pay up at the top?”
Summary Data DBS
| Last price | 76.50 SGD |
| Change 1 day / 5 days / 1 month | -0.64% / 2.68% / 6.21% |
| Trend / MA-cross | uptrend / none |
| SMA20 / SMA50 | 74.07 / 69.22 |
| RSI (14) / Stochastic %K | 66.7 / 59.0 |
| Bollinger %B / ATR | 94% / 1.24 |
| Support / Resistance 20 days | 71.90 / 76.99 |
| Data as of | 12 Agustus 2026 08:00 WIB |


