AIA Stock Drops 0.41% Today, Testing Support Level
On Agustus 14, 2026: price 72.55 HKD, trend sideways, RSI 37.2, support 72.65, resistance 79.65. technical analysis of aia stock. AIA Stock Drops — full…

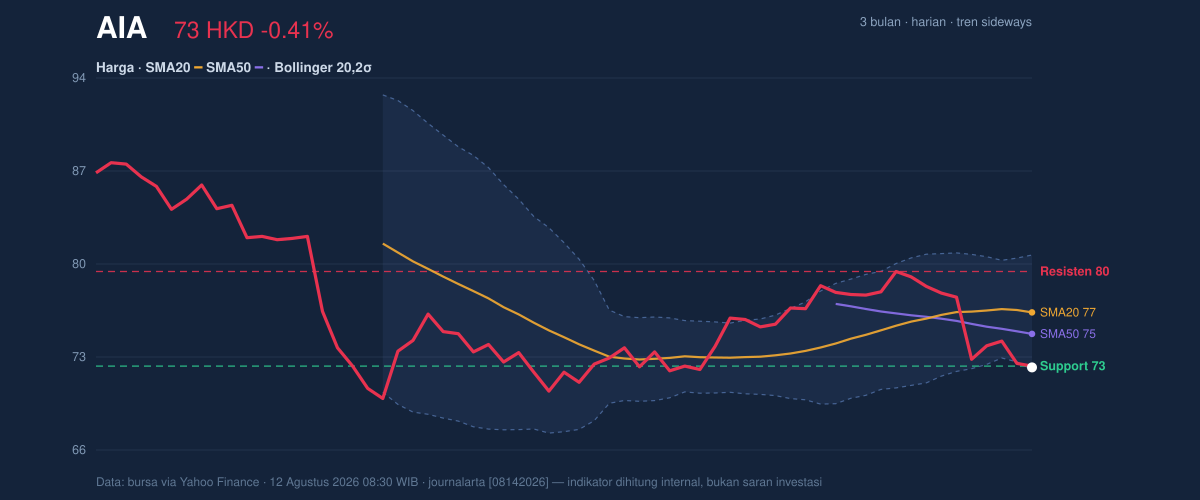
AIA Group fell to 72.55 HKD, down 0.41% on the day, leaving the insurer just below a short-term floor that has been watched closely by traders. The move matters because the stock is now trading under both its SMA20 at 76.63 and SMA50 at 75.03, a setup that usually signals the recent recovery attempt has lost traction. As shown in the chart, the price is also pressing against the lower edge of its Bollinger band, which tells us the market is no longer paying for optimism and is instead testing where demand still exists.
Trend & Price Action
The broader pattern is still best described as sideways, but the tone has weakened. The SMA20 slope of -0.02% over 5 days shows that the short-term average is drifting lower rather than stabilising, and that makes the failure to reclaim the moving averages more important than the headline label of “sideways.” In practical terms, the stock is not trending cleanly in either direction; it is sliding within a range while buyers have become less willing to defend higher levels.
That is also visible in the distance from the recent range. The 3-month high of 89.00 remains far above the current price, while the 3-month low of 69.05 is not far beneath it. When a stock sits closer to the lower end of its 3-month band than the upper end, the market is effectively saying that the balance of power has shifted toward caution. The current price is only about 1% from the 20-day support zone at 72.65, which means the next move is likely to be judged by whether that line holds or gives way.
Oscillators & Momentum
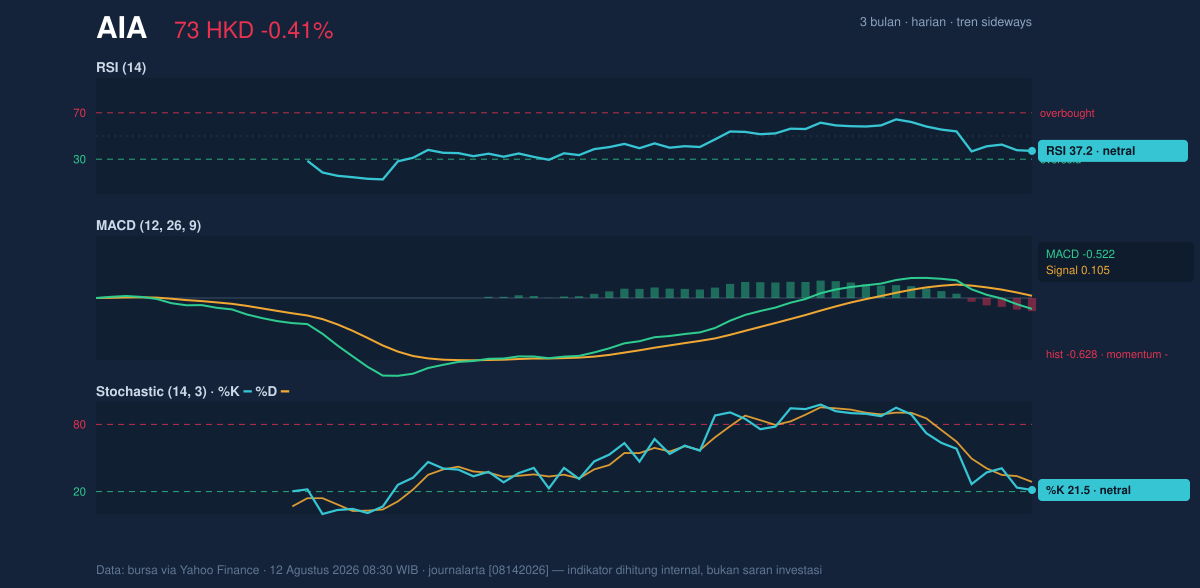
Momentum is not strongly oversold, but it is clearly weak. The RSI at 37.2 sits below the midpoint, which suggests the stock has lost upward energy without yet reaching a classic panic level. That matters because a low-but-not-extreme RSI often means sellers remain in control, but the market has not yet flushed out enough pressure to invite a decisive rebound.
The Stochastic %K at 21.5 and %D at 28.6 point to the same message. This is near the lower end of the scale, so the stock is close to oversold territory, but the reading alone does not confirm a turn. The more important signal is that the oscillator remains weak while price continues to trade beneath the moving averages, which means momentum is still aligned with the downside rather than fighting it.
The clearest warning comes from MACD. With MACD at -0.522, the signal line at 0.105, and the histogram at -0.628, the indicator is negative and widening against the stock. In plain language, MACD is showing that recent price action has been weaker than the longer trend it is compared against, and the gap is still unfavourable. As shown in the chart, there is no sign yet of a bullish crossover that would suggest the slide is losing force.
Volatility & Volume
Volatility is present, but not extreme. The ATR(14) at 2.10, equal to 2.9% of price, indicates the stock can still move enough in a session to matter, yet the Bollinger band width of 11.1% shows conditions are not unusually compressed or stretched. That combination usually points to a market that is active but not explosive. In other words, the next break lower or higher may not be dramatic in percentage terms, but it can still be meaningful because the stock is sitting near the edge of its recent range.
Volume adds a cautious note. Last trading volume of 31,933,300 was 1.2× the 20-day average of 27,050,076, so the decline was not caused by a quiet session. More participants were involved than usual, and that often strengthens the signal behind the move. The fact that OBV is falling reinforces the point: money flow has been leaning away from the stock, which weakens the case that the recent drop is merely noise.
Key Levels & Scenarios
The nearest reference point is support at 72.65. That level is especially important because the last price at 72.55 is already slightly beneath it, meaning the market is testing the line rather than comfortably sitting above it. If the stock fails to recover this area, the next meaningful downside reference is the 3-month low at 69.05. On the upside, resistance at 79.65 is the first level that would need to be reclaimed before the chart could begin to repair its short-term damage.
The Bollinger structure helps frame the same scenario. With the middle band at 76.63 and the upper band at 80.87, any recovery would first need to push back above the mid-band before traders could argue that the stock is escaping its current weak phase. Until then, rallies are more likely to be treated as attempts to retest resistance rather than proof of a trend reversal.
Technical Verdict: HOLD (wait & see)
HOLD (wait & see) — the chart is weak, but not yet broken enough to justify a decisive directional call.
- MACD is negative and the histogram is still widening below zero, which confirms downside momentum remains in place.
- Price is below SMA20 and SMA50, so the stock has not yet regained the short- or medium-term trend.
- RSI at 37.2 and Stochastic %K at 21.5 show weakness, but not a full oversold washout that would usually mark a clearer turning point.
- Verdict invalidated if price falls below 69.05, the 3-month low.
- Ideal Entry Range: 72.65 to 75.03, using the support zone and SMA50 as the first area where price stability would need to return.
- Exit Target: 76.63 to 79.65, anchored to the SMA20 and the nearest resistance.
- Stop Loss protection: below 69.05, where the 3-month low would no longer be intact.
In plain English, the stock is weak enough to demand patience, but not weak enough to force a one-way conclusion.
Summary Data AIA
| Last price | 72.55 HKD |
| Change 1 day / 5 days / 1 month | -0.41% / -6.69% / -4.79% |
| Trend / MA-cross | sideways / none |
| SMA20 / SMA50 | 76.63 / 75.03 |
| RSI (14) / Stochastic %K | 37.2 / 21.5 |
| Bollinger %B / ATR | 2% / 2.10 |
| Support / Resistance 20 days | 72.65 / 79.65 |
| Data as of | 12 Agustus 2026 08:30 WIB |


