Shell Stock Technicals Today: Gains 2.05%, Testing Key Resistance
On Agustus 19, 2026: price 3,388.00 GBp, trend uptrend, RSI 56.7, support 3,234.50, resistance 3,405.50. technical analysis of shell stock.

Shell plc edged higher on the LSE on 17 August 2026, with the shares last trading at 3,388.00 GBp, up from 3,320.00 the previous close, as the stock pushed to the upper edge of its recent trading band. The move keeps Shell in an uptrend, but the chart also shows a market that is stretched near resistance while momentum is no longer fully aligned with price, a combination that often precedes either a pause or a decisive breakout.
Trend & Price Action
Shell remains above both its SMA20 at 3,312.35 and SMA50 at 3,153.35, which is the simplest sign that the medium-term structure still points higher. The 20-day average is rising at 1.10% over 5 days, so the trend is not just positive in direction but still improving in slope, a useful distinction because a flat average would suggest a fading move rather than an active one.
That said, the price is now sitting very close to the top of the Bollinger envelope, with the upper band at 3,391.80 and the last print at 3,388.00. As shown in the chart, that places Shell near a technical ceiling rather than in the middle of a comfortable trend channel. The stock is also trading at about 90% of its 20-hour range, which signals that most of the recent intraday room to run has already been used up.
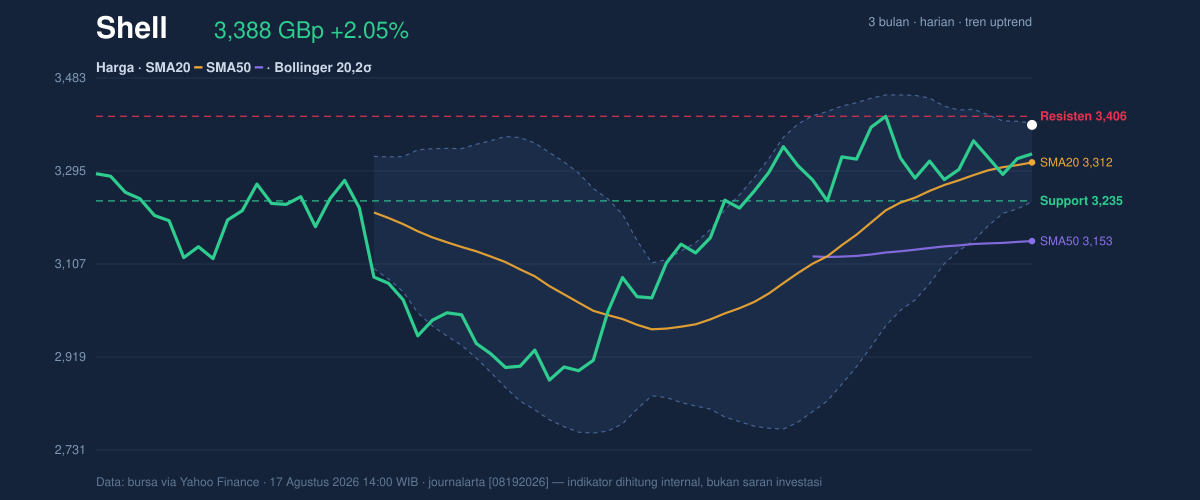
The broader range still matters. Shell is well below its 3-month high of 3,758.50 and comfortably above the 3-month low of 2,559.50, so the stock is neither testing long-term extremes nor breaking down. In plain terms, the trend is constructive, but the current price is asking a lot of buyers if it is to extend much further without a fresh catalyst.
Oscillators & Momentum
The momentum picture is more mixed than the price chart alone suggests. RSI at 56.7 is neutral-to-positive, meaning the shares are not overbought and still have room to rise if demand improves. Stochastic %K at 45.5 and %D at 40.3 is also neutral, which tells readers the stock is not yet showing the kind of stretched condition that usually triggers an immediate reversal.
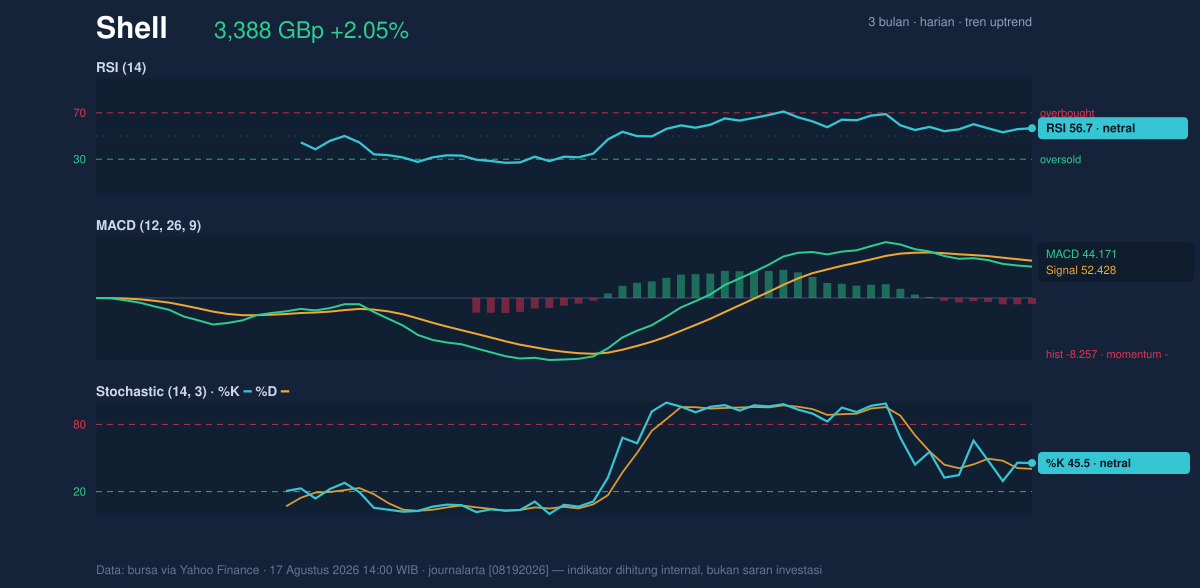
The harder signal comes from MACD. MACD at 44.171 remains below its signal line at 52.428, leaving a -8.257 histogram. That negative histogram matters because it shows the shorter-term impulse has weakened even while the broader trend remains upward. In other words, Shell is climbing on a still-positive price structure, but the internal push behind that climb is not as strong as the headline trend would imply.
This is the kind of setup that can produce either a brief consolidation or a breakout if buyers return with conviction. The oscillators are not warning of an imminent collapse; they are warning that the move is no longer being confirmed by momentum in the way a cleaner advance would be.
Volatility & Volume
Volatility is moderate, with ATR(14) at 71.27, or 2.1% of price. That suggests Shell can still move meaningfully in a session, but not in a disorderly way. More important is the Bollinger setup: the band width is just 4.8%, which points to a squeeze. Squeezes often precede expansion, so the market is compressing rather than trending in a straight line. The key question is direction, and the current evidence is not fully conclusive.
Volume does not yet confirm the latest rise. Trading volume was 5,166,041, compared with the 20-hour average of 8,510,681, or about 0.6× normal. That means the advance is happening on lighter participation, which weakens the case that the move has broad market backing. The OBV is falling as well, reinforcing the idea that accumulation is not yet keeping pace with price. When price rises but volume and OBV soften, the market is often drifting higher rather than being forcefully bid.
Key Levels & Scenarios
The most important nearby levels are clear. Resistance sits at 3,405.50, just above the current price, while support is at 3,234.50. That creates a relatively tight decision zone: Shell is close enough to resistance that upside follow-through needs confirmation, but still far enough above support that the trend has not been damaged.
If the shares clear 3,405.50 with stronger participation, the squeeze in Bollinger bands suggests the move could extend quickly as compressed volatility releases. If instead price fails to hold above the upper band and slips back toward the middle band at 3,312.35, the chart would look more like a consolidation than a breakout. A loss of 3,234.50 would be more serious, because it would place the stock back into the lower part of the recent range and challenge the current uptrend structure.
Technical Verdict: HOLD (wait & see)
HOLD (wait & see)
- Price is above SMA20 and SMA50, which keeps the medium-term trend constructive.
- MACD is negative versus its signal line, showing momentum is not fully confirming the price rise.
- Volume is only 0.6× normal and OBV is down, so the latest strength lacks strong participation.
- Verdict invalidated if price breaks below 3,234.50, which would weaken the current trend structure.
- Ideal Entry Range: 3,312.35 to 3,334.00
- Exit Target: 3,405.50
- Stop Loss protection: 3,232.90
In plain English, Shell still looks technically healthy, but the shares need stronger confirmation before the recent rise can be treated as more than a pause near resistance.
"At this level, the market is asking whether Shell has enough fuel left to break higher, or whether the rally has already used up its first burst of momentum."
Summary Data Shell
| Last price | 3,388.00 GBp |
| Change 1 day / 5 days / 1 month | 2.05% / 2.73% / 5.22% |
| Trend / MA-cross | uptrend / none |
| SMA20 / SMA50 | 3,312.35 / 3,153.35 |
| RSI (14) / Stochastic %K | 56.7 / 45.5 |
| Bollinger %B / ATR | 98% / 71.27 |
| Support / Resistance 20 days | 3,234.50 / 3,405.50 |
| Data as of | 17 Agustus 2026 14:00 WIB |


