HSBC Stock Technicals Today: Drops 1.41%, Testing Support Level
On Agustus 20, 2026: price 161.20 HKD, trend sideways, RSI 55.0, support 158.90, resistance 168.20. technical analysis of hsbc stock. HSBC Stock Technicals —…

At 161.20 HKD, HSBC Holdings on HKEX is trading below its 20-day moving average at 162.85 but still well above its 50-day moving average at 154.75, a setup that reads less like a clean trend and more like a market pausing inside a wider range. The share price is down 1.41% on the day, even as it remains up 3.00% over one month, which suggests recent momentum has cooled without fully breaking the broader recovery. As shown in the chart, the stock sits near the lower part of its near-term band, with the market waiting for a clearer signal from volume and momentum.
Trend & Price Action
The structure is still best described as sideways, and the detail that matters is the slope of the SMA20 at 0.85% over five days. That indicates the short-term average is edging higher, but not fast enough to confirm a strong directional move. In practical terms, this is the kind of drift that often precedes either a breakout or a fade, depending on whether buyers can reclaim the short-term average. The absence of a fresh MA-cross also matters: there is no new moving-average signal to mark a decisive shift in control, even though the SMA50 at 154.75 remains below price and acts as a deeper cushion.
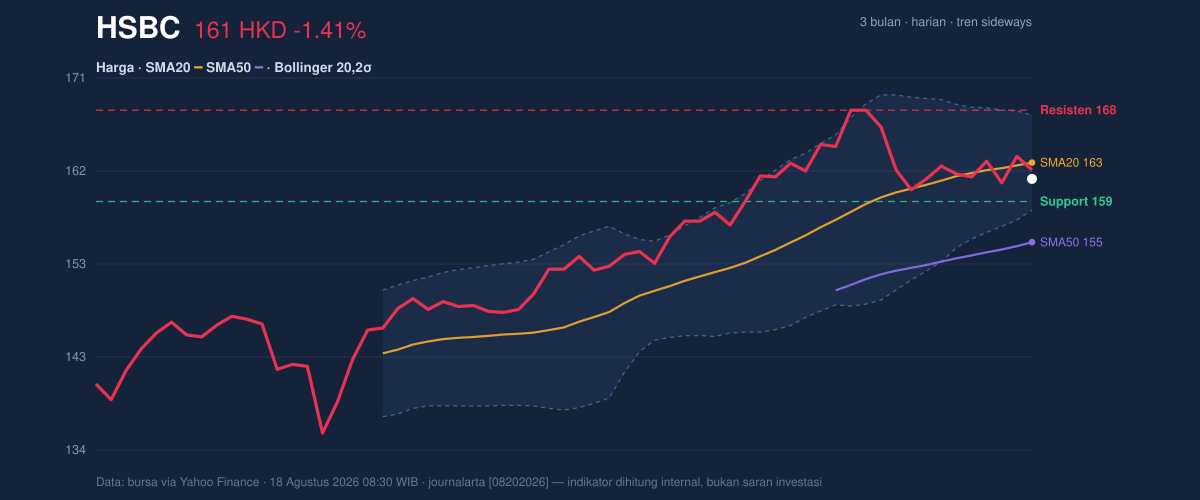
The stock is trading at about the 25% point of its 20-day support-resistance range, between 158.90 and 168.20. That placement is important because it shows HSBC is not collapsing toward support, but neither is it pressing resistance with conviction. The broader three-month range, from 133.50 to 169.70, places the current price closer to the upper half of that band, which is consistent with a market that has recovered but has not yet proven it can extend the move.
A short move down, but not a broken structure.
Oscillators & Momentum
The oscillator picture is mixed rather than bearish. RSI at 55.0 is neutral-to-constructive, meaning the stock is not overbought and still has room to advance if buyers return. But the Stochastic %K at 37.7 and %D at 38.0 sit in neutral territory and are not flashing a strong reversal signal. The more cautionary reading comes from MACD at 1.922 versus signal at 2.613, leaving a -0.691 histogram. That negative histogram means short-term momentum has slipped below its signal line, a sign that the pace of the advance has weakened even if the longer structure has not fully turned down.
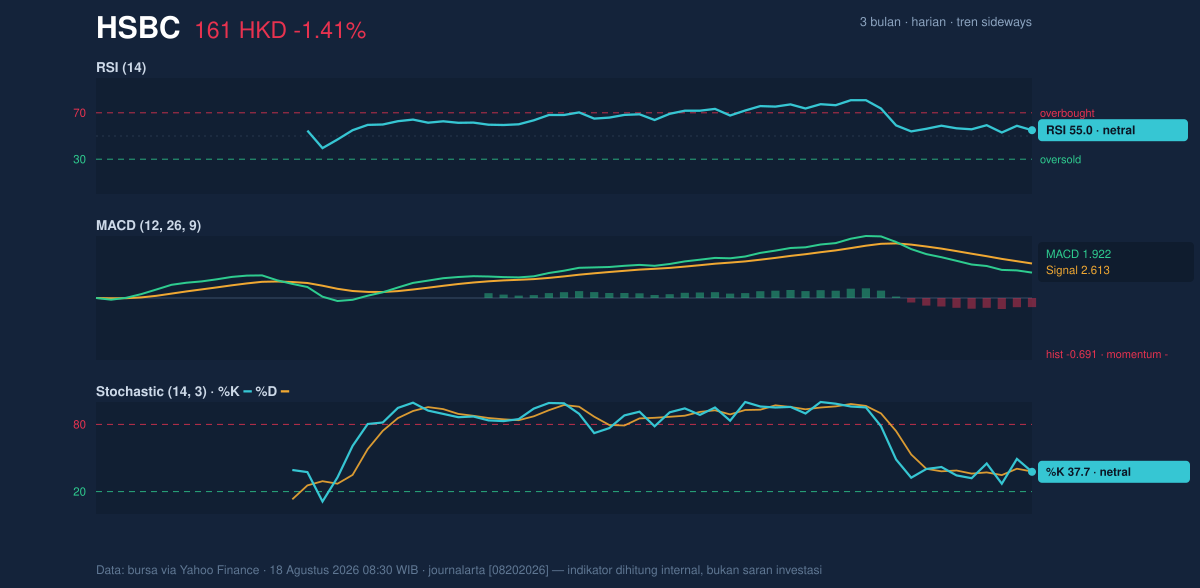
This combination is usually more telling than any single indicator. RSI says the stock is not stretched; MACD says it is losing thrust. Stochastic agrees that the market is neither overheated nor deeply washed out. In plain language, HSBC is not showing panic selling, but it is also not showing the kind of momentum that typically powers a clean push through resistance.
Volatility & Volume
Volatility is contained but not dead. The Bollinger Bands are relatively tight, with the upper band at 167.68 and the lower band at 158.03, while the 5.9% band width is described as a squeeze. A squeeze matters because it often comes before a larger move; it does not tell direction, only that the stock has been compressing and may be preparing for expansion. The current %B at 33% shows price is sitting in the lower third of the band, which reinforces the idea that the stock is leaning soft rather than strong, but still within a controlled range.
The volume story is less supportive. Last volume of 5,696,185 was only 0.4x the 20-day average of 13,702,138, and OBV is falling. OBV, or on-balance volume, tracks whether volume is flowing into or out of the stock; a decline suggests sellers have had the upper hand in participation even if the price has not broken down. That matters because a squeeze without volume confirmation can stay compressed longer than expected, or resolve in a false move.
Liquidity is not absent, but conviction is.
Key Levels & Scenarios
The nearest floor is 158.90, the 20-day support level. A clean hold above that area would keep the current range intact and leave room for a retest of the upper band. Below that, 158.03 on the Bollinger lower band becomes the next technical reference, and a failure there would expose the market to a deeper pullback toward the 154.75 SMA50. On the upside, 162.85 is the first checkpoint because it is the SMA20 and the Bollinger middle band; reclaiming it would suggest the stock is regaining short-term balance. Above that, 167.68 and then 168.20 define the resistance area, with the three-month high at 169.70 marking the broader ceiling.
The signal is therefore conditional: if HSBC can move back above 162.85 with stronger participation, the squeeze may resolve upward; if it slips under 158.90, the current sideways pattern starts to look more fragile.
Technical Verdict: HOLD (wait & see)
HOLD (wait & see) fits the chart because the stock is still above the SMA50 at 154.75, but below the SMA20 at 162.85, while MACD momentum is negative and volume is running at only 0.4x of average. The Bollinger squeeze says a larger move may be coming, but the market has not yet shown which way. RSI at 55.0 and Stochastic near 38 keep the setup neutral rather than broken.
- Ideal entry range: 158.90 to 162.85, where support and the short-term average converge.
- Exit target: 167.68 to 168.20, the upper band and resistance zone.
- Stop loss protection: below 158.03, with 154.75 as the deeper line of defense.
- Verdict invalidated if price breaks below 158.03, because that would turn the squeeze into a downside break rather than a pause.
For non-traders, this means HSBC is still holding its ground, but the chart is asking for proof before the next move becomes clearer.
Volume last: 5,696,185 versus 20-day average 13,702,138, with OBV declining.
Summary Data HSBC
| Last price | 161.20 HKD |
| Change 1 day / 5 days / 1 month | -1.41% / -0.31% / 3.00% |
| Trend / MA-cross | sideways / none |
| SMA20 / SMA50 | 162.85 / 154.75 |
| RSI (14) / Stochastic %K | 55.0 / 37.7 |
| Bollinger %B / ATR | 33% / 2.81 |
| Support / Resistance 20 days | 158.90 / 168.20 |
| Data as of | 18 Agustus 2026 08:30 WIB |



