Shell Stock Gains 2.73% Today, Testing Key Resistance
On Agustus 20, 2026: price 3,420.50 GBp, trend uptrend, RSI 61.3, support 3,234.50, resistance 3,405.50. technical analysis of shell stock.

Shell plc climbed on the London Stock Exchange on 18 August 2026, with the shares last changing hands at 3,420.50 GBp, up 2.73% on the day and extending a 1 month gain of 5.12%. The move keeps the stock in an established uptrend, but the technical picture is no longer straightforward: price is pressing above the upper Bollinger band, momentum is mixed, and volume is running well below normal, which means the latest advance is being tested rather than broadly confirmed.
Trend & Price Action
Shell remains above both its SMA20 at 3,319.05 and SMA50 at 3,157.46, a simple but important sign that the medium-term structure is still constructive. The uptrend is also supported by the SMA20 slope of 0.99% over 5 days, showing that the shorter moving average is still rising rather than flattening out. In practical terms, that tells readers the stock is not merely bouncing; it is still being carried by a positive trend.
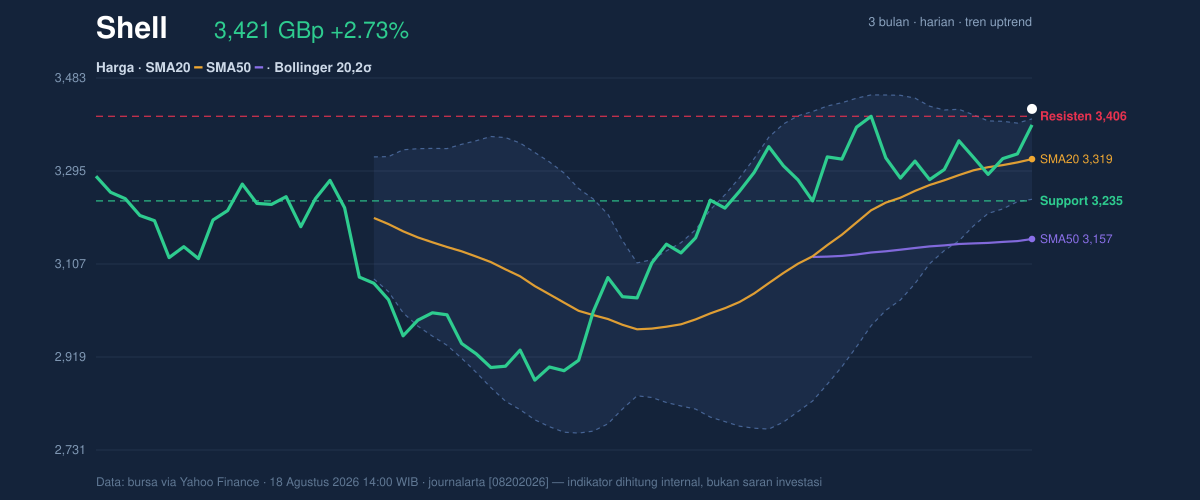
The issue is location. At 3,420.50 GBp, Shell is trading above the 20-hour resistance at 3,405.50 and sits at 109% of the range, which means it is already beyond the upper end of the recent trading band. The chart also shows the shares above the upper Bollinger band at 3,400.27, a sign that price has stretched ahead of the recent average. That can happen in strong trends, but it also often warns that the market is running hot and may need to consolidate before it can extend further.
The broader backdrop is still favourable, with the stock well above its 3,234.50 support and not far from the upper half of its 3 month range between 2,559.50 and 3,758.50. But the absence of a new MA-cross matters: there is no fresh moving-average crossover to signal a new acceleration phase, so the current move is still an extension of the existing trend rather than a fresh breakout regime.
Oscillators & Momentum
Momentum is where the story becomes more cautious. The RSI at 61.3 is still neutral, which means the stock is not yet in a classic overbought condition on that measure. That matters because RSI often acts as a temperature check: above 70 would suggest a more crowded move, while the current reading says there is still room before the trend becomes technically overstretched.
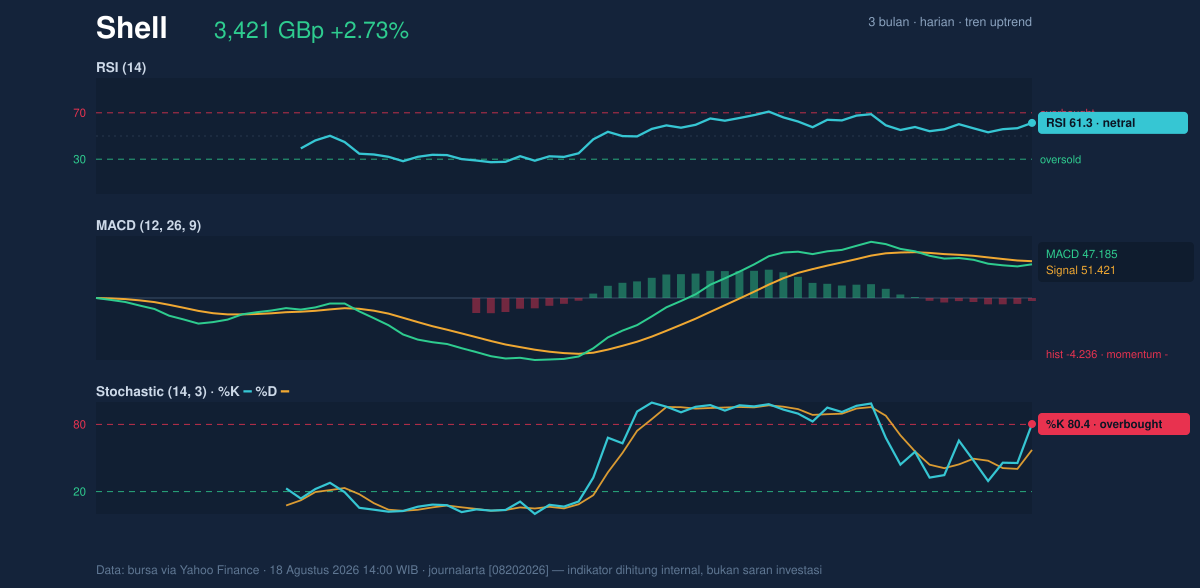
The Stochastic %K at 80.4 versus %D at 57.2 is a different signal, and it is explicitly overbought. Stochastic tends to react faster than RSI, so this reading suggests the recent advance has moved quickly and may be vulnerable to pauses or pullbacks. At the same time, the MACD at 47.185 remains below its signal at 51.421, with a -4.236 histogram. That combination is important: it says the trend is still positive on price, but the internal momentum has weakened, so the latest push is not yet fully confirmed by the trend-following oscillator.
This split between price strength and oscillator weakness often appears near local highs. It does not automatically mean reversal, but it does mean traders should watch whether the stock can hold above its breakout area or whether the move was simply a temporary overshoot.
Volatility & Volume
Volatility is moderate, with ATR(14) at 69.73, equal to about 2.0% of price. In plain language, that suggests daily swings are meaningful but not extreme, so any break above resistance can still travel, while any failure of support can also move quickly. The Bollinger band width of 4.9% is relatively tight and is described as a squeeze, which often precedes a larger directional move. The tension here is that price is already outside the upper band, so the squeeze is being tested from the top rather than from the middle.
Volume does not yet validate the breakout attempt. Last volume was 5,423,564, against a 20-hour average of 8,410,764, or just 0.6× normal. That is a weak participation signal. When price rises on lighter volume, it can still work, but the move is more fragile because fewer buyers are visibly supporting it. The OBV is down, which reinforces that concern: on-balance volume tracks whether trading flow is broadly accumulating or distributing, and a falling OBV says the market has not yet shown convincing accumulation behind the price rise.
Key Levels & Scenarios
The nearest decision points are clear. Immediate resistance is 3,405.50, and Shell is already above it, so the market is trying to convert resistance into support. The first meaningful floor is 3,400.27, the upper Bollinger band, followed by 3,319.05 at the SMA20. A clean hold above those areas would keep the trend intact and reduce the chance that this is just an overextended spike.
If price continues to hold above 3,405.50 and volume improves, the chart would suggest a stronger continuation phase is developing. If it slips back below 3,400.27 and then loses 3,319.05, the market would likely be signalling that the recent breakout attempt has faded and that the stock is reverting toward its trend base. The deeper support to watch remains 3,234.50, which is the key line separating a routine pause from a more serious technical unwind.
Technical Verdict: HOLD (wait & see)
- Price is above SMA20 and SMA50, so the broader trend is still positive.
- Stochastic is overbought and MACD is below signal, which warns that momentum is softening even as price rises.
- Volume is only 0.6× normal and OBV is down, so the move lacks strong participation.
Verdict invalidated if price breaks and holds below 3,234.50.
- Ideal entry range: 3,319.05 to 3,400.27
- Exit target: 3,405.50 initially, then the next test of the upper range if momentum improves
- Stop loss protection: 3,234.50
In plain English, Shell is still in an uptrend, but the latest rise looks a bit stretched and needs stronger volume to prove it can keep going.
"Until participation improves, this is a market asking for confirmation, not applause."
Summary Data Shell
| Last price | 3,420.50 GBp |
| Change 1 day / 5 days / 1 month | 2.73% / 1.92% / 5.12% |
| Trend / MA-cross | uptrend / none |
| SMA20 / SMA50 | 3,319.05 / 3,157.46 |
| RSI (14) / Stochastic %K | 61.3 / 80.4 |
| Bollinger %B / ATR | 112% / 69.73 |
| Support / Resistance 20 days | 3,234.50 / 3,405.50 |
| Data as of | 18 Agustus 2026 14:00 WIB |


