OCBC Stock Gains 0.55%, Momentum Weakens In Focus
On Agustus 31, 2026: price 31.07 SGD, trend uptrend, RSI 61.6, support 28.63, resistance 31.79. technical analysis of ocbc stock. OCBC Stock Gains — full…

OCBC Bank’s shares on SGX were last quoted at 31.07 SGD, up 0.55% on the day, and the move keeps the stock in a constructive medium-term uptrend even as some short-term momentum gauges cool. The share price is still trading above its short and medium moving averages, but the latest chart signals show a market that is advancing with less force than the price alone might suggest.
Trend & Price Action
The clearest message from the chart is that OCBC remains in an uptrend, with the SMA20 at 30.59 and the SMA50 at 28.44 both sitting below the current price. That matters because it tells investors the market has not only recovered above recent trading levels, but is also holding above its broader trend base. The SMA20 slope of 1.60% over 5 days reinforces that the near-term trend is still rising, even though there is no fresh MA-cross to suggest a new acceleration phase.
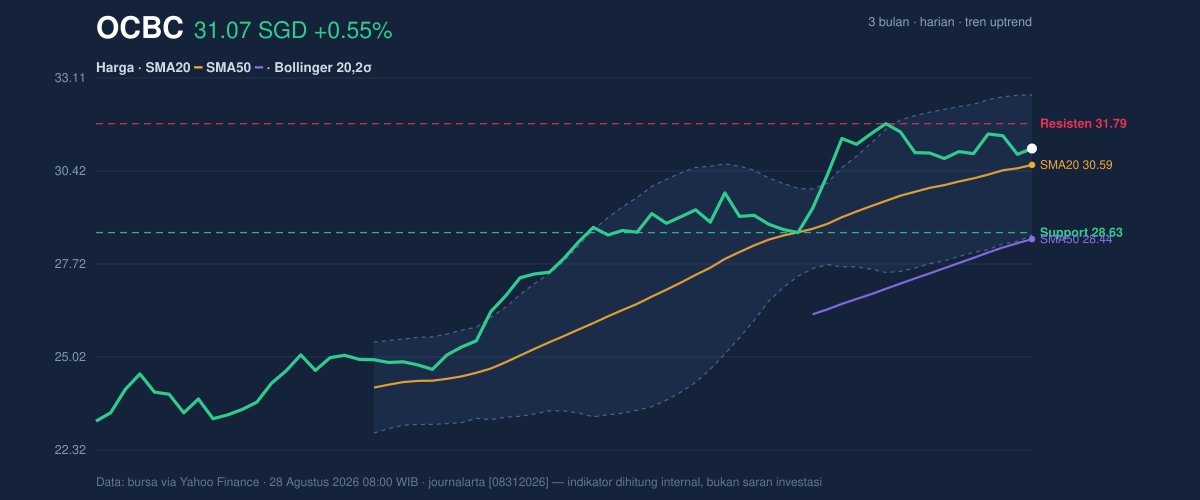
Price is now positioned at about 77% of the 20-hour range, which places it in the upper part of the recent band rather than near the middle or lower end. In plain terms, the market is close to the top of its short-term trading corridor, but not yet at the extreme. That fits with the 3-month high of 31.86 sitting just above the current quote, while the 3-month low of 23.11 remains far below and confirms how much of the earlier weakness has already been unwound.
The key practical signal here is that OCBC is no longer cheap on a short-term chart, but it is still being supported by trend structure. The stock is holding above the middle Bollinger line and above both moving averages, which usually means buyers still control the broader path, even if they are no longer pushing aggressively.
Oscillators & Momentum
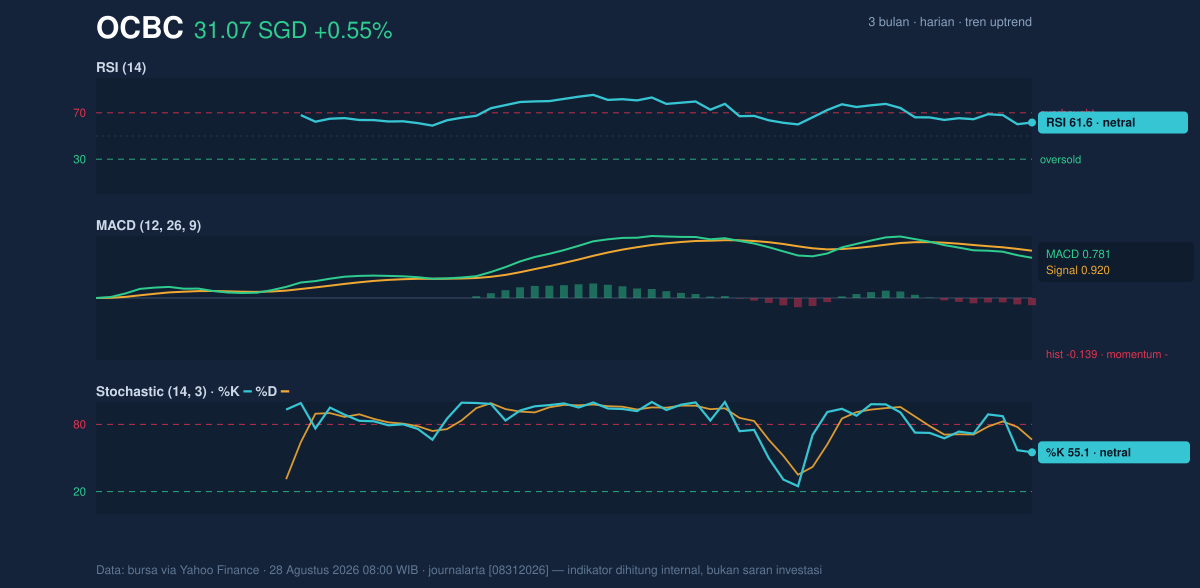
Momentum is more mixed than the price trend. The RSI at 61.6 is still neutral rather than overbought, which suggests the rally has room to continue if buyers reappear. But the Stochastic %K at 55.1 and %D at 66.5 are also neutral, and the fact that %K is below %D hints that near-term upside pressure is easing. That is not a reversal signal on its own, but it does show the stock is not charging higher with strong internal momentum.
The more cautionary clue comes from the MACD at 0.781, which sits below the signal line at 0.920, leaving a -0.139 histogram. For general readers, that means the trend is still positive on the chart, but the pace of that trend has weakened. MACD often turns before price does, so a negative histogram while price remains firm is a classic sign of momentum divergence: the stock can still rise, but it may need fresh buying support to keep climbing.
That combination matters. The price trend is still up, but the momentum profile is no longer fully aligned with it. In market terms, OCBC looks supported, yet not especially energetic.
Volatility & Volume
The Bollinger setup is also telling. With the upper band at 32.62, middle band at 30.59, and lower band at 28.56, the stock is trading above the center line but below the upper band. The %B at 62% shows price is leaning toward the upper half of the band, while the 13.3% band width points to normal volatility rather than a breakout squeeze or an unusually stretched move. In other words, the chart does not yet show the kind of compression that often precedes a sharp move, nor the kind of expansion that confirms one.
ATR(14) at 0.63, or 2.0% of price, also indicates moderate day-to-day movement. That is important because it suggests the stock can still swing, but not in an especially erratic way. For a bank stock, that usually means the next move is more likely to be guided by participation than by panic.
Participation, however, is the weak spot. Latest volume of 4,375,100 is only 0.7× normal compared with the 20-hour average of 6,655,109, and OBV is falling. OBV, or on-balance volume, tracks whether volume is flowing into or out of a stock. A declining OBV while price holds up suggests the advance is not being strongly confirmed by trading activity. That does not break the trend, but it does warn that the move may be vulnerable if buyers do not return.
Key Levels & Scenarios
The nearest technical floor is the 20-hour support at 28.63, which sits just above the Bollinger lower band at 28.56. That clustering is useful because when support and band floor sit close together, the area often becomes a first test of whether a pullback is merely routine or something more serious. On the upside, the first ceiling is the 20-hour resistance at 31.79, just beneath the 3-month high of 31.86. That makes the top of the recent range the obvious battleground.
If OCBC clears and holds above 31.79, the chart would be pointing back toward the recent high zone, with the upper Bollinger band at 32.62 becoming the next technical reference. If instead the shares slip back below 30.59, the middle Bollinger line and SMA20 would stop acting as support and the chart would look more like a consolidation than a clean continuation. A break under 28.63 would be more consequential because it would put the lower band and short-range support in play together.
Technical Verdict: HOLD (wait & see)
The setup is constructive, but not decisive. The price is above the SMA20 and SMA50, which supports the broader uptrend, yet the MACD histogram is negative and volume is below normal, showing that momentum and participation are not fully confirming the price strength. The RSI at 61.6 remains healthy, but it is not strong enough to override the softer signals from MACD and OBV.
- Ideal entry range: 30.59 to 31.07, where the price sits near the SMA20 and current quote area.
- Exit target: 31.79 to 31.86, the resistance zone and recent high area.
- Stop loss protection: 28.63, the key support level aligned with the lower end of the recent range.
This verdict is invalidated if price breaks below 28.63, because that would damage the current trend structure and put the lower Bollinger band under pressure.
For non-traders: the chart still leans upward, but the stock is now waiting for stronger volume and momentum to prove the move can continue.
Summary Data OCBC
| Last price | 31.07 SGD |
| Change 1 day / 5 days / 1 month | 0.55% / 0.29% / 6.77% |
| Trend / MA-cross | uptrend / none |
| SMA20 / SMA50 | 30.59 / 28.44 |
| RSI (14) / Stochastic %K | 61.6 / 55.1 |
| Bollinger %B / ATR | 62% / 0.63 |
| Support / Resistance 20 days | 28.63 / 31.79 |
| Data as of | 28 Agustus 2026 08:00 WIB |



