Alibaba Stock Analysis: Drops 1.39%, Testing Support Level
On Agustus 31, 2026: price 113.90 HKD, trend sideways, RSI 43.9, support 112.50, resistance 128.10. technical analysis of alibaba stock.
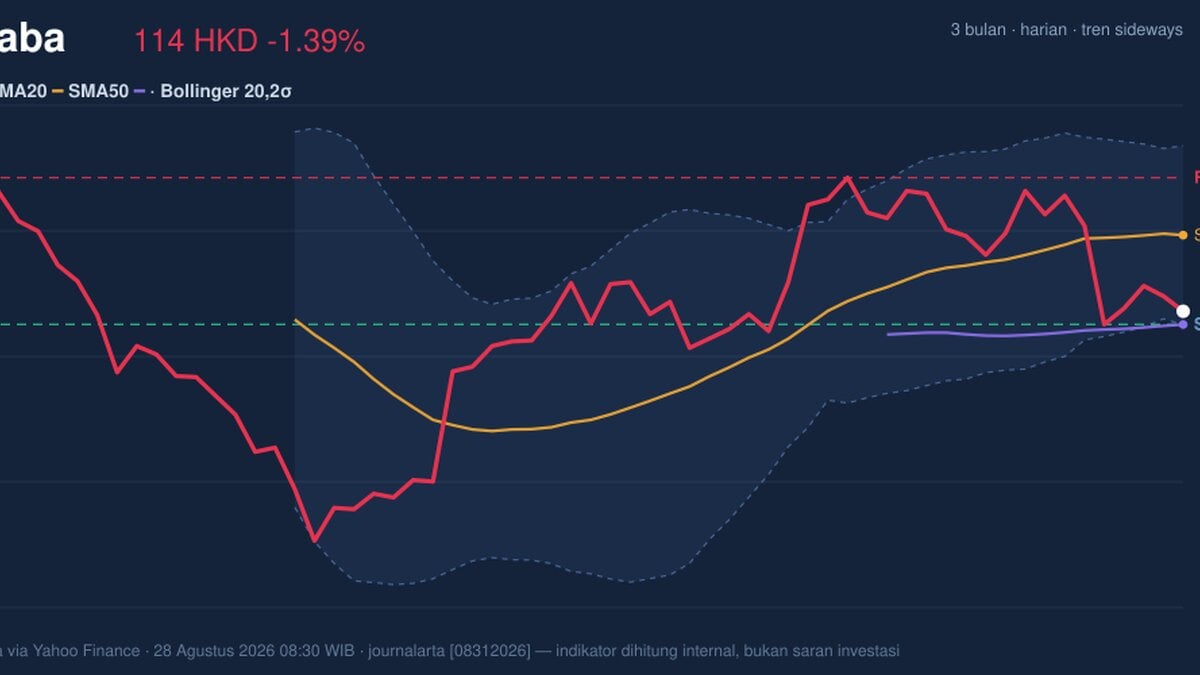
Alibaba Group’s Hong Kong shares fell to HK$113.90 on 28 August 2026, slipping 1.39% from the previous close as the stock stayed below its short-term average and hovered near the lower end of its recent trading range. The move matters less as a one-day drop than as a signal of where sellers are still in control: price is sitting under SMA20 at HK$121.99, while the broader medium-term line at SMA50 at HK$112.49 is now acting as the next floor. As shown in the chart, Alibaba is not in a clean breakout or breakdown; it is caught in a band where momentum has weakened, but not yet collapsed.
Trend & Price Action
The stock is described as sideways, and that is consistent with the latest technical structure: the SMA20 slope is only 0.30% over 5 days, which means the short-term trend is barely rising and lacks conviction. Price below SMA20 usually signals that recent buying pressure has faded, but the absence of a new MA-cross tells us the chart has not produced a decisive trend reversal signal yet. In practical terms, Alibaba is trading in a wait-and-test zone rather than a trend-confirmation zone.
The position within the range is also important. The shares are at only 9% of the 20-hour range, with support at HK$112.50 and resistance at HK$128.10. That places the stock much closer to the lower boundary than the upper one, which usually means the market is testing whether buyers will defend the floor or whether the range will shift lower.
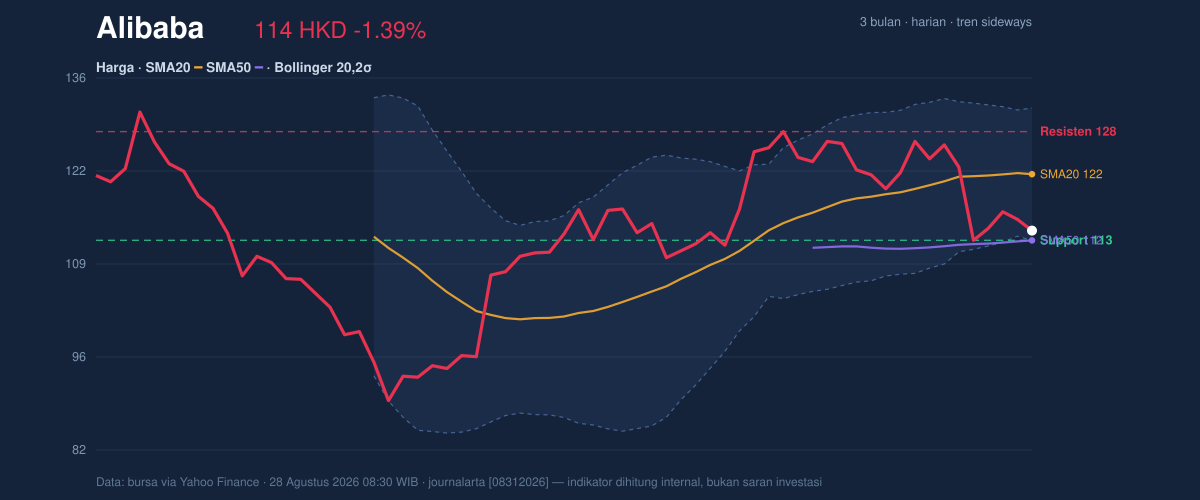
The longer lens is mixed: the 3-month high is HK$131.20 and the 3-month low is HK$88.65, so the current level is far from panic territory, but also well short of the recent ceiling. That gap suggests the market has room to recover if sentiment improves, yet the chart is currently behaving like a stock that needs proof before it can attract stronger follow-through.
Oscillators & Momentum
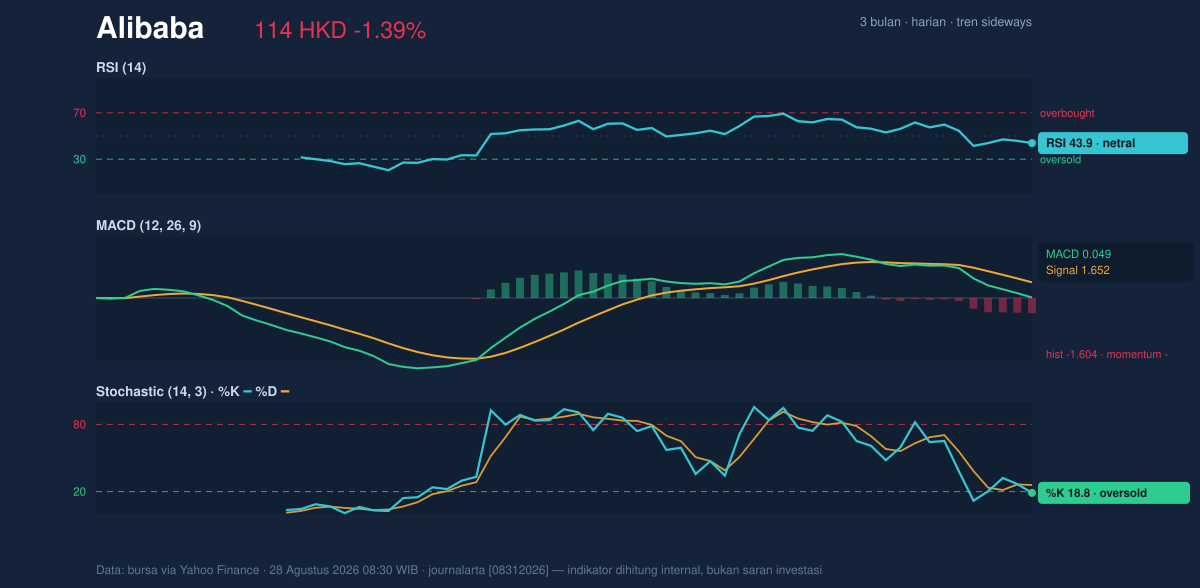
Momentum is split, and that is the key message from the oscillators. The RSI at 43.9 is neutral, which means the stock is neither overbought nor deeply oversold on a broad momentum basis. But the Stochastic %K at 18.8 and %D at 25.9 are in oversold territory, indicating the latest selling has pushed the stock into a short-term stretched condition. That does not guarantee a rebound; it simply means downside pressure may be tiring if volume and price action confirm it.
The more cautionary signal comes from MACD at 0.049 versus the signal line at 1.652, with a histogram of -1.604. MACD is a trend-following momentum indicator, and this setup shows momentum is still negative even if the price is not breaking down aggressively. In plain language, the stock is not yet showing the kind of momentum turn that typically accompanies a sustained recovery. The oscillators are hinting at compression near a lower band, but the MACD says the trend impulse still leans down.
That split is why the chart feels fragile rather than decisively bearish.
Volatility & Volume
The Bollinger Band structure adds another layer. Price is trading near the lower band, with Bollinger %B at 7%, which means the stock is very close to the bottom of its recent volatility envelope. The band width is 15.6%, described as normal, so this is not a squeeze setup where volatility is unusually compressed and ready to explode. Instead, the stock is sitting low inside a standard band, which often reflects weak demand rather than a calm pre-breakout base.
Volatility itself is elevated: ATR(14) is HK$4.85, or 4.3% of price. ATR measures the average daily trading range, so a higher reading means the stock can move sharply even without a major news trigger. That matters because a small change in sentiment could quickly push Alibaba toward either the support line or the upper band.
Volume, however, is not confirming a strong reversal. Last volume was 73,086,522, below the 20-day average of 105,028,188, or 0.7× normal. Lower-than-average turnover on a down move often suggests the selling is not panicked, but it also means buyers are not stepping in with force. The OBV is falling, which is a bearish participation signal: on-balance volume tracks whether money flow is accumulating or leaving the stock, and a decline implies distribution is still outweighing accumulation.
Key Levels & Scenarios
The market is now focused on two levels: support at HK$112.50 and resistance at HK$128.10. The SMA50 at HK$112.49 sits almost exactly on support, making that zone especially important. If price holds above that shelf, the chart can remain range-bound and potentially stabilize. If it slips below, the technical picture weakens materially because both the moving average and the range floor would have failed together.
On the upside, a move back through SMA20 at HK$121.99 would be the first sign that short-term sellers are losing grip. Only then does HK$128.10 become the next meaningful test. As shown in the chart, the stock would need both price recovery and better participation to make that move credible.
Technical Verdict: HOLD (wait & see)
HOLD (wait & see) — the chart is neither strong enough to confirm a recovery nor weak enough to declare a clean breakdown.
- RSI is neutral at 43.9, so momentum is not oversold enough on its own to justify a decisive bullish read.
- Stochastic is oversold and price is near Bollinger lower band / %B 7%, which suggests downside may be stretched, but not yet reversed.
- MACD remains negative and OBV is falling, showing trend momentum and participation are still soft.
Verdict invalidated if price falls below HK$112.49.
- Ideal Entry Range: HK$112.50 to HK$114.00
- Exit Target (Target Price): HK$121.99, then HK$128.10
- Stop Loss protection: below HK$112.49
For non-traders: the stock is sitting on a key support line, but the momentum is not yet strong enough to call a recovery.
Summary Data Alibaba
| Last price | 113.90 HKD |
| Change 1 day / 5 days / 1 month | -1.39% / -7.40% / -2.65% |
| Trend / MA-cross | sideways / none |
| SMA20 / SMA50 | 121.99 / 112.49 |
| RSI (14) / Stochastic %K | 43.9 / 18.8 |
| Bollinger %B / ATR | 7% / 4.85 |
| Support / Resistance 20 days | 112.50 / 128.10 |
| Data as of | 28 Agustus 2026 08:30 WIB |
Track Alibaba share price daily: live levels, support/resistance and our full Alibaba analysis history.