Tencent Stock Analysis: Gains 1.16%, Momentum Weakens
On September 1, 2026: price 453.00 HKD, trend sideways, RSI 50.4, support 440.00, resistance 492.20. technical analysis of tencent stock.

Tencent Holdings traded in Hong Kong with its shares at HKD 453.00, up 1.16% from the previous close of 447.80, but the move sits inside a broader tape that still looks hesitant rather than decisive. The stock is below its SMA20 at 459.89 and just below its SMA50 at 453.80, which matters because price is now pressing against a short-term reference line without yet reclaiming it cleanly. In plain terms, the market is saying the recent bounce has not yet turned into a trend change.
Trend & Price Action
The chart shows Tencent moving in a sideways trend, with the SMA20 sloping down by -0.79% over 5 days. That slope is small, but it signals that the near-term path of least resistance is still soft. Price is also sitting in the lower part of its recent band: the stock is at about 25% of the 20-hour range between support at 440.00 and resistance at 492.20. That positioning tells us buyers have defended the lower zone, but they have not yet forced a breakout through the overhead supply.
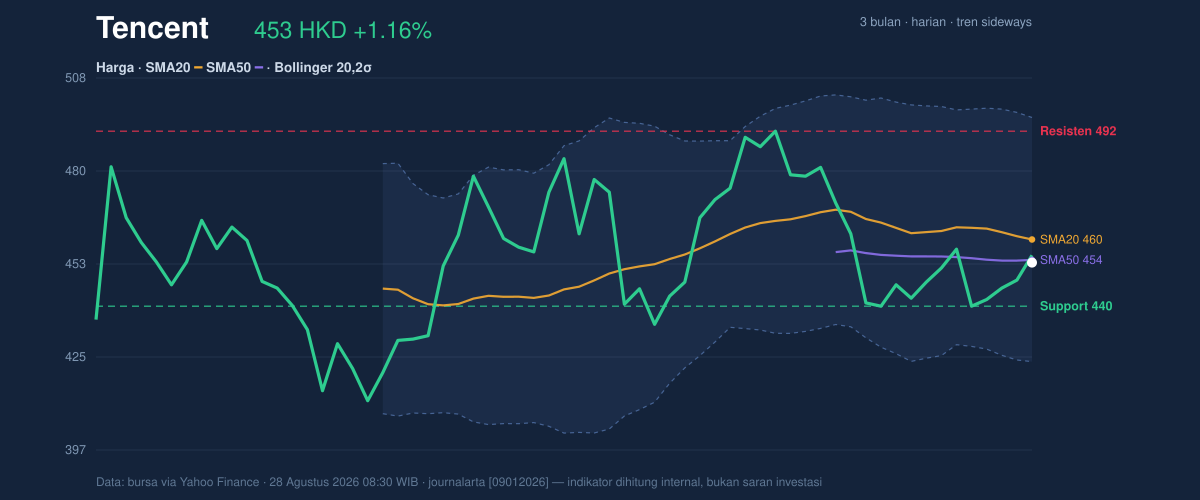
The broader context is equally important. Tencent’s 3-month high of 497.80 and 3-month low of 411.00 frame a market that has already traveled a wide distance, but the current price remains closer to the lower half of that range than the upper half. The absence of a fresh MA-cross also matters: there is no new moving-average signal confirming a stronger directional shift. For now, the chart reads as consolidation under pressure, not a trend resumption.
A bounce, yes. A breakout, not yet.
Oscillators & Momentum
Momentum indicators are mostly neutral, which is a useful warning sign. The RSI at 50.4 sits right on the fence between bullish and bearish territory, so it is not giving a strong directional edge. The Stochastic %K at 40.2 and %D at 28.2 also point to a market that is neither oversold nor overbought, though the gap between the two lines suggests some short-term recovery is building from a weaker position. That kind of setup can support a rebound, but only if price follows through.
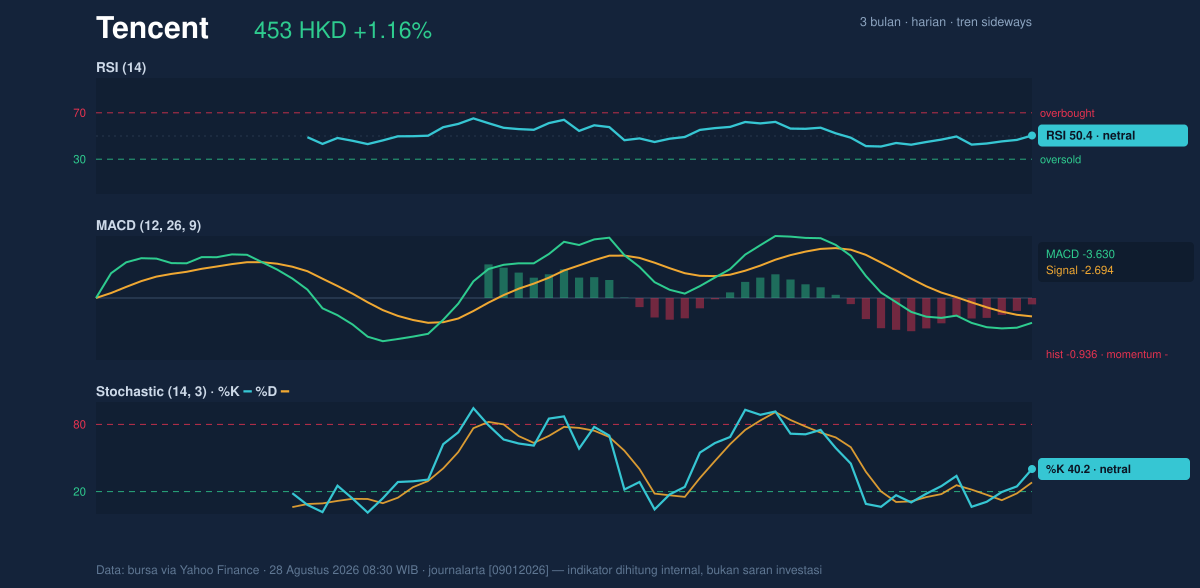
The more telling signal is the MACD at -3.630, still below its signal line at -2.694, with a histogram of -0.936. That combination means downside momentum is still present even though it is not extreme. In practical terms, the stock is not in free fall, but the trend engine has not fully turned back in favor of buyers. Neutral oscillators plus a negative MACD often describe a market that is trying to stabilize before choosing a direction.
Volatility & Volume
Tencent’s Bollinger Bands are relatively orderly, with a normal band width of 15.8%. That suggests the stock is not in a volatility squeeze or an expansion phase; instead, it is trading in a measured range. The %B at 41% places price below the middle band and closer to the lower half of the channel, which reinforces the message from the moving averages: the stock is still recovering from weakness, not yet trading with strong upward momentum.
The ATR(14) at 12.21, equal to 2.7% of price, indicates moderate daily movement. That is enough for meaningful swings, but not enough to imply panic or disorder. Volume adds a constructive nuance. Last session’s 27,742,475 shares traded, about 1.1× normal, while OBV is rising. OBV, or on-balance volume, tracks whether volume is flowing into or out of the stock; a rising line means buyers have recently been more active than sellers across the tape. That does not erase the negative MACD, but it does suggest the recent lift is being supported by participation rather than just thin trading.
Volume is improving. Trend confirmation is not.
Key Levels & Scenarios
The immediate map is clear as shown in the chart: support at 440.00 is the first line that matters, while resistance at 492.20 caps the current range. Between those two levels, the price action is still working out whether this is a base or just a pause. The Bollinger middle band at 459.89 is also important because it sits near the SMA20 and acts as a pivot; reclaiming it would improve the tone, while failing there would keep the stock pinned in the lower half of the range.
If price holds above 440.00 and pushes back through 459.89, the setup improves because that would mean Tencent is reclaiming its short-term average and moving toward the upper part of the band. If it then clears 492.20, the market would be challenging the upper boundary of the recent range and the 497.80 three-month high would come back into view. If, however, 440.00 gives way, the chart would be warning that the recent stabilization has failed and that the lower end of the broader range near 411.00 becomes relevant again.
Technical Verdict: HOLD (wait & see)
HOLD (wait & see) because the chart is mixed: price is below the SMA20 and just below the SMA50, MACD remains negative, and the trend is still marked sideways. At the same time, OBV is rising and volume is running at 1.1× normal, which means buyers are showing up, but not yet with enough force to flip the technical picture decisively.
- Ideal Entry Range: 440.00 to 453.80, where support and the SMA50 overlap
- Exit Target: 459.89 first, then 492.20 if the stock regains the middle band and resistance
- Stop Loss protection: below 440.00, since that would break the nearest support
- Verdict invalidated if price breaks below 440.00
For non-traders: Tencent is trying to recover, but the chart still needs proof that the rebound has real strength.
“The market is still asking the same question: is this a floor, or just a pause before another leg lower?”
Summary Data Tencent
| Last price | 453.00 HKD |
| Change 1 day / 5 days / 1 month | 1.16% / -0.88% / -4.67% |
| Trend / MA-cross | sideways / none |
| SMA20 / SMA50 | 459.89 / 453.80 |
| RSI (14) / Stochastic %K | 50.4 / 40.2 |
| Bollinger %B / ATR | 41% / 12.21 |
| Support / Resistance 20 days | 440.00 / 492.20 |
| Data as of | 28 Agustus 2026 08:30 WIB |



