AIA Stock Gains 2.14% Today, Death Cross Pressure
On September 1, 2026: price 76.25 HKD, trend sideways, RSI 53.1, support 70.40, resistance 78.55. technical analysis of aia stock. AIA Stock Gains — full…
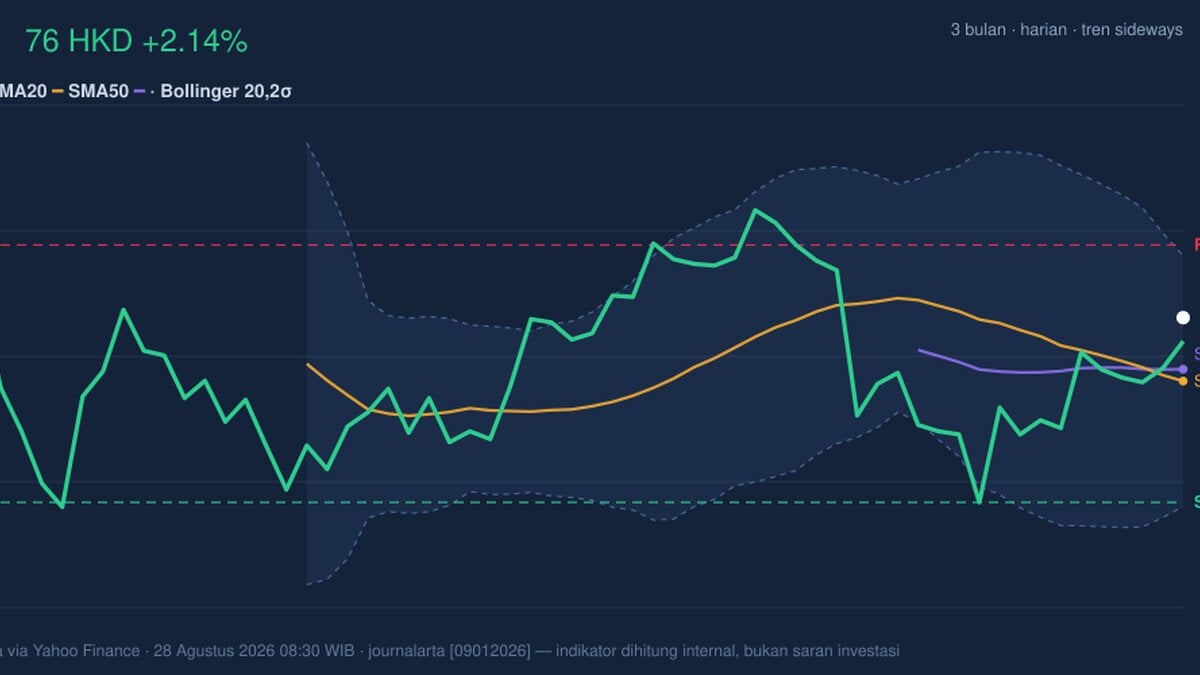
AIA Group’s shares rose 2.14% to HKD 76.25 in Hong Kong on 28 August 2026, recovering part of the recent softness but still trading in a market structure that is more cautious than decisive. The stock is above its SMA20 at 74.24 and just above its SMA50 at 74.62, yet the chart still carries a death cross signal, meaning the shorter-term average has slipped below the longer one. That combination usually tells traders the rebound is real enough to notice, but not yet strong enough to erase the broader hesitation. As shown in the chart, AIA is sitting around the middle-upper part of its recent range rather than at an outright breakout point.
Trend & Price Action
The price action is best described as sideways, with the SMA20 slope down 1.30% over 5 days. That matters because a falling short-term average often reflects a market that is still digesting prior selling, even when the latest session looks firm. In plain terms, the stock has stopped falling cleanly, but it has not yet established a convincing upward trend.
The latest close also sits within the upper half of the recent band, at about 72% of the 20-hour range, which suggests buyers have regained some control inside the range. But the broader context is still bounded by support at 70.40 and resistance at 78.55. Those levels matter more than the daily percentage move because they define where the market has already shown interest. A push toward resistance would test whether this rebound has real follow-through; failure there would reinforce the idea that the stock remains range-bound.
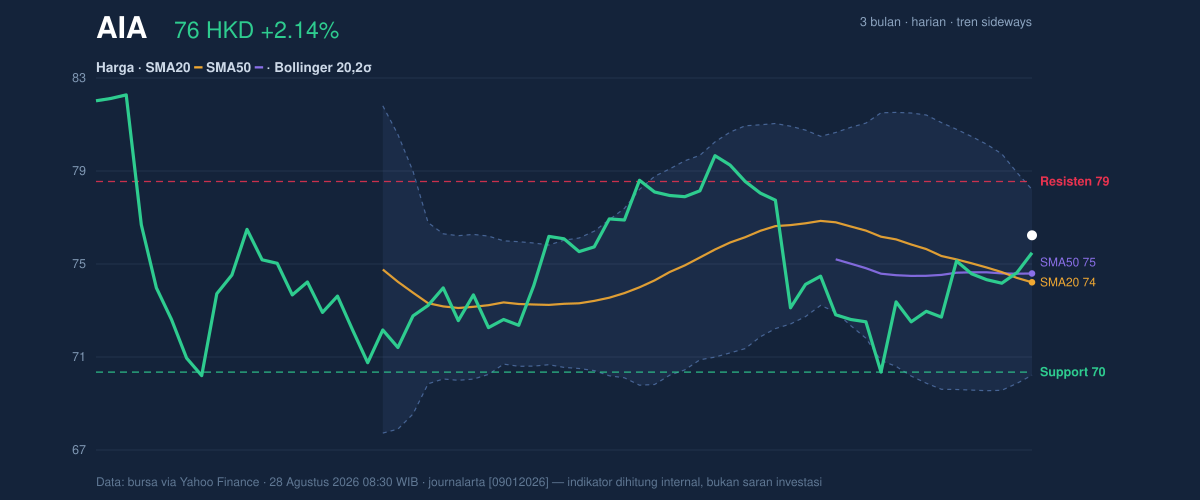
The Bollinger Bands add a useful layer. Price is above the middle band at 74.24 and still below the upper band at 78.21, with %B at 75%. That means the stock is trading in the upper part of its recent volatility envelope, but not yet pressing the ceiling. The 10.7% band width is normal, not compressed, so the chart does not point to an imminent volatility breakout by itself. Instead, it suggests the current move has room to extend, but only if volume and momentum confirm it.
Oscillators & Momentum
Momentum is mixed, and that is the key signal from the oscillators. The RSI at 53.1 is neutral, which usually means the stock is neither stretched nor washed out. That is important because a neutral RSI leaves room for either direction; it does not force a reversal, and it does not confirm a trend. By contrast, the Stochastic %K at 86.9 and %D at 79.7 are in overbought territory, which often shows the short-term rally has moved faster than the broader market has validated. In practical terms, this can mean the stock is vulnerable to a pause even if the trend has not cracked.
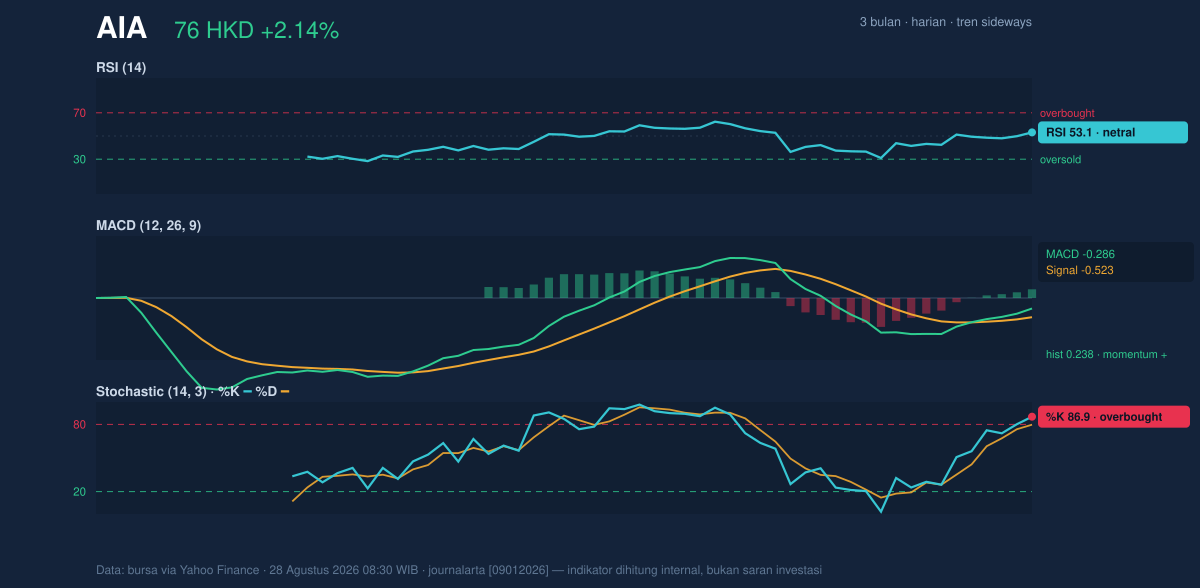
The MACD at -0.286 remains below zero, but the signal line at -0.523 and histogram at 0.238 show improvement. That is a subtle but important signal: momentum is turning more positive even while the indicator itself is still technically negative. For readers unfamiliar with MACD, the histogram turning positive means the faster line is gaining on the slower one, which often appears before a broader trend shift. So the message here is not “bullish breakout,” but rather “early repair.” The chart is showing recovery energy, yet the overbought Stochastic warns that some of that energy may already be priced in for the short term.
Volatility & Volume
Trading activity does not yet fully support the latest bounce. Volume was 26,471,858, below the 20-day average of 33,095,415, or about 0.8× normal. That matters because advances on lighter volume can be less durable: they may reflect short covering or passive buying rather than broad conviction from institutions and long-term holders. The OBV is falling, which deepens that caution. OBV, or on-balance volume, tracks whether volume is flowing into strength or weakness; a decline means the stock has recently seen more distribution than accumulation, even if the price has bounced.
ATR at 1.87, or about 2.5% of price, points to moderate volatility. That is consistent with a market that can move, but not wildly. It also means the stock can test nearby levels without needing a dramatic news shock. In a sideways setup, moderate ATR often keeps the range intact unless volume expands and momentum aligns.
Key Levels & Scenarios
The nearest line in the sand remains support at 70.40. If that level holds, the stock can continue to work higher inside the range and potentially retest 78.55 resistance. If resistance gives way, the next signal would be that the recent death cross is losing influence and the chart is attempting a more durable recovery. If support fails, the current bounce would look more like a countertrend move than the start of a new leg.
The 3-month range frames the bigger picture: 69.05 on the low end and 82.85 on the high end. That tells us the stock is not trapped in a narrow corridor, but it is also still well below the upper end of the recent band. The market is effectively asking whether AIA can reclaim the top half of that 3-month range with conviction, or whether it will remain a stock that rallies into resistance and fades back.
Technical Verdict: HOLD (wait & see)
HOLD (wait & see) is the clearest read from the current chart because the price is improving, but the evidence is not yet uniform.
- Reason 1: Price is above SMA20 at 74.24 and SMA50 at 74.62, which supports the rebound.
- Reason 2: MACD histogram at 0.238 is positive, showing momentum repair.
- Reason 3: Stochastic at 86.9/79.7 is overbought, while volume at 0.8× normal and falling OBV argue against chasing strength too aggressively.
- Verdict invalidated if price breaks below 70.40, because that would put the stock back under near-term support and weaken the current range structure.
- Ideal Entry Range: 74.24 to 74.62
- Exit Target: 78.21 to 78.55
- Stop Loss protection: below 70.40
In plain English, the chart says AIA is recovering, but it has not yet proved that the recovery is strong enough to trust.
Summary Data AIA
| Last price | 76.25 HKD |
| Change 1 day / 5 days / 1 month | 2.14% / 1.46% / -3.79% |
| Trend / MA-cross | sideways / death |
| SMA20 / SMA50 | 74.24 / 74.62 |
| RSI (14) / Stochastic %K | 53.1 / 86.9 |
| Bollinger %B / ATR | 75% / 1.87 |
| Support / Resistance 20 days | 70.40 / 78.55 |
| Data as of | 28 Agustus 2026 08:30 WIB |
Track AIA share price daily: live levels, support/resistance and our full AIA analysis history.