UOB Stock Gains 0.66%, Momentum Gains In Focus
On September 14, 2026: price 41.26 SGD, trend sideways, RSI 46.8, support 40.22, resistance 42.01. technical analysis of uob stock. UOB Stock Gains — full…

United Overseas Bank slipped and then steadied on SGX, with U11.SI last changing hands at SGD 41.26 in early trading on 11 September 2026, up from the previous close of 40.99. The move leaves the stock in a sideways pattern rather than a clear uptrend or downtrend, and the chart shows a market that is trying to hold above its short-term average while still trading below a longer one.
Trend & Price Action
As shown in the chart, UOB is sitting above its SMA20 at 41.14 but below its SMA50 at 42.26, which is a classic sign of a market that has recovered from near-term weakness but has not yet repaired the broader trend. That matters because a stock above the faster average but under the slower one often reflects hesitation: buyers are active enough to prevent a deeper slide, yet not strong enough to reclaim the longer-term slope.
The absence of a fresh MA-cross reinforces that message. There is no new moving-average crossover to signal a decisive shift in trend, and the SMA20 slope of -0.50% over 5 days suggests the short-term bias is still mildly soft even though price is holding above it. In practical terms, the market is not breaking down, but it is also not showing the kind of follow-through that usually confirms a new advance.
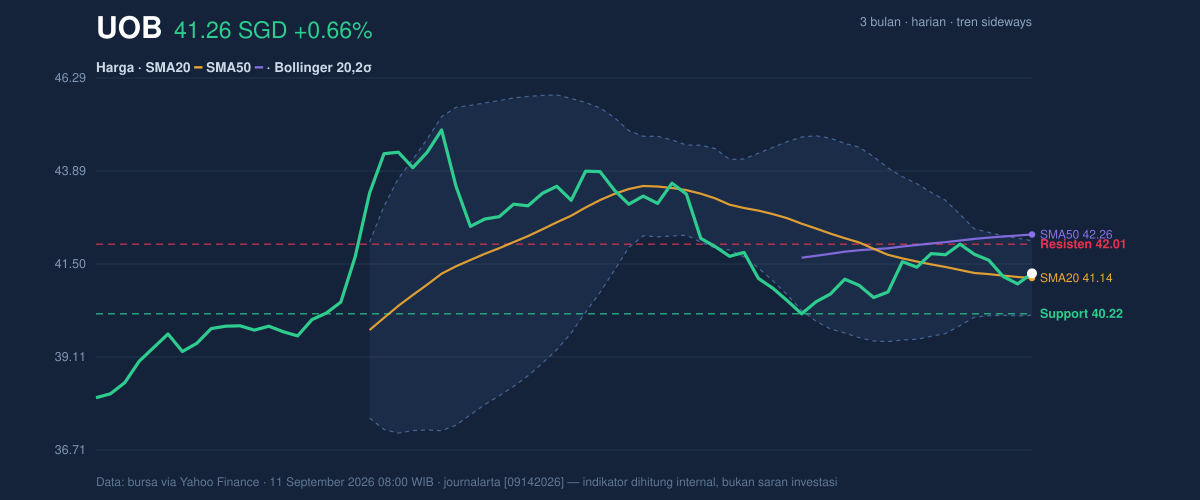
The stock is trading at 58% of its 20-hour range, which places it in the upper half of the recent band without being stretched to the top. That positioning matters because it shows buyers have regained some control intraday, but the share price is still well shy of the 3-month high at 45.15 and comfortably above the 3-month low at 37.52. In other words, UOB is not in distress, but it is also not yet challenging the upper end of its broader range.
Oscillators & Momentum
The momentum gauges are mostly neutral, which fits the sideways price structure. RSI at 46.8 sits just below the midpoint, telling readers that the stock is neither overbought nor oversold and that recent buying pressure has been modest rather than forceful. A neutral RSI often means the market is waiting for a catalyst instead of already pricing one in.
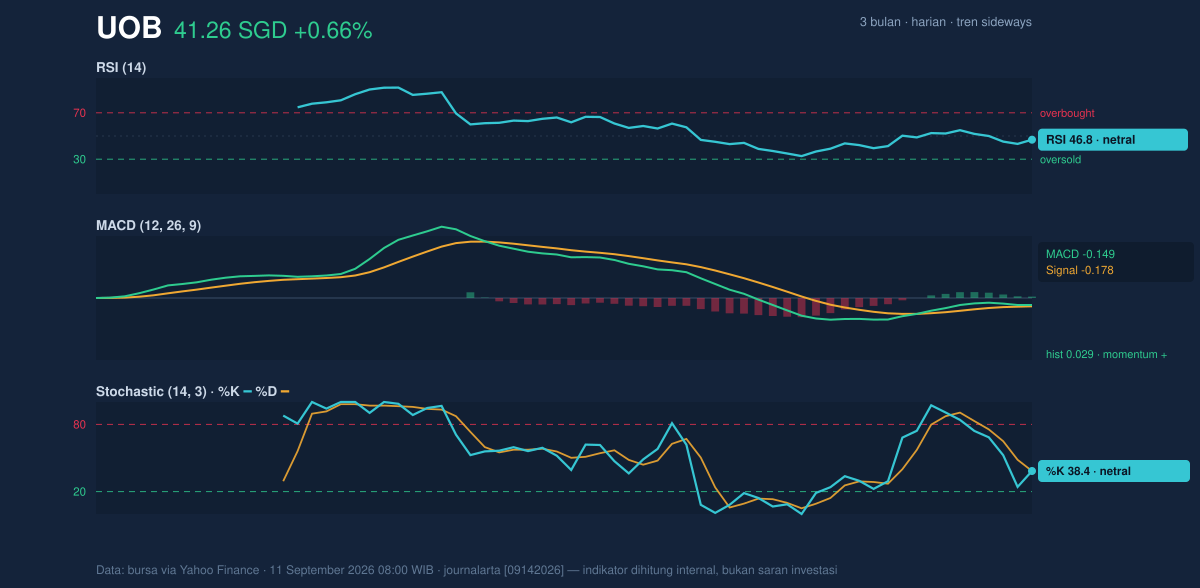
The Stochastic %K and %D at 38.4 are also neutral, but they sit in the lower half of the scale, which suggests momentum has improved from weaker territory without yet turning robust. The more constructive signal comes from the MACD at -0.149 versus the signal line at -0.178, leaving a positive histogram of 0.029. That configuration means short-term momentum has turned slightly better than the trend backdrop, even though it has not yet become strong enough to overturn the broader sideways-to-soft setup.
The takeaway from the oscillators is subtle but important: momentum is not bearish enough to confirm a breakdown, yet it is not strong enough to argue that the next move has already started. That is often the kind of technical backdrop that precedes a range expansion, especially when the price sits near the middle of its band.
Volatility & Volume
Volatility is low, and that usually means the market is compressing rather than trending. UOB’s ATR(14) at 0.49, or 1.2% of price, signals relatively quiet trading conditions, while the Bollinger Bands are narrowing to a 4.7% width. A narrowing band, or squeeze, often indicates that the market is storing energy for a larger move, but it does not tell us direction on its own.
The current Bollinger position is also balanced: price sits near the middle with %B at 56%, which means UOB is slightly above the band midpoint but not near the upper edge at 42.10. That is consistent with a stock that is stabilizing rather than breaking out. If price can push through the upper band, the squeeze would begin to resolve upward; if it rolls over, the same compression could unwind toward the lower band at 40.18.
Volume, however, is not yet confirming conviction. The latest turnover of 1,936,500 is only 0.7× normal versus the 20-hour average of 2,737,675, and OBV is falling. That combination matters because a price rebound on lighter-than-usual volume can be fragile; it suggests the latest uptick has not yet attracted broad participation. For a bank stock like UOB, that lack of volume support often means the move is more of a pause than a trend change.
Key Levels & Scenarios
The immediate map is clear. Support at 40.22 is the first level that needs to hold if the stock is to keep its current base intact, while resistance at 42.01 is the nearest ceiling that has to be cleared before the chart can improve materially. Those levels are close enough to the current price that they define the next trading decision more than the longer-term averages do.
If UOB can stay above 40.22 and then push through 42.01, the chart would shift from range-bound to constructive, with the upper Bollinger band at 42.10 and the SMA50 at 42.26 becoming the next technical tests. If it fails to hold 40.22, the squeeze would likely resolve downward first toward 40.18, then potentially back toward the lower end of the broader range near 37.52.
Technical Verdict: HOLD (wait & see)
HOLD (wait & see) fits the current setup because the stock is trapped between a recovering short-term base and a still-weak longer-term average, while momentum remains neutral.
- Reason 1: Price is above SMA20 at 41.14 but below SMA50 at 42.26, which leaves the trend mixed rather than confirmed.
- Reason 2: RSI at 46.8 and Stochastic at 38.4/38.4 show neutral momentum, while the MACD histogram at 0.029 is only mildly positive.
- Reason 3: The Bollinger squeeze at 4.7% suggests a bigger move may be coming, but volume at 0.7× normal and falling OBV do not yet confirm direction.
- Verdict invalidated if price breaks below 40.22, because that would weaken the current support base and raise the odds of a move toward the lower band.
- Ideal entry range: 40.22 to 41.14
- Exit target: 42.01 to 42.26
- Stop loss protection: below 40.18
For non-traders, this means UOB is not flashing a clear directional signal yet, and the next important clue will come from whether it can hold 40.22 or reclaim 42.01.
Summary Data UOB
| Last price | 41.26 SGD |
| Change 1 day / 5 days / 1 month | 0.66% / -1.79% / -1.29% |
| Trend / MA-cross | sideways / none |
| SMA20 / SMA50 | 41.14 / 42.26 |
| RSI (14) / Stochastic %K | 46.8 / 38.4 |
| Bollinger %B / ATR | 56% / 0.49 |
| Support / Resistance 20 days | 40.22 / 42.01 |
| Data as of | 11 September 2026 08:00 WIB |


