Death Cross Pressure, Alibaba Stock Gains 0.56% Today
On September 14, 2026: price 107.50 HKD, trend downtrend, RSI 38.5, support 106.90, resistance 126.70. technical analysis of alibaba stock.

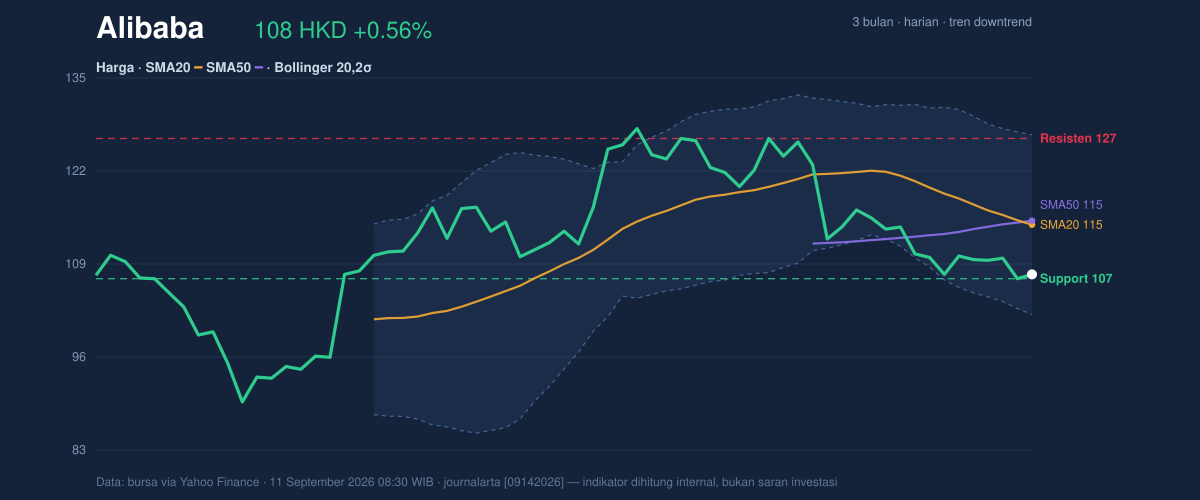
Alibaba Group’s Hong Kong-listed shares slipped to HKD 107.50 on HKEX, extending a broader pullback that has left the stock below both short- and medium-term trend markers, with the chart showing a death cross and price trading deep under the 20-day and 50-day averages. The move matters less as a one-day drift and more as a signal that the market is still treating rallies as fragile: the stock is sitting near the lower end of its recent range, momentum is weak, and participation has thinned.
Trend & Price Action
The most important signal on the price chart is that Alibaba is not just falling; it is falling in a way that confirms trend deterioration. The shares are below SMA20 at HKD 114.52 and SMA50 at HKD 115.10, while the death cross — when the faster average moves beneath the slower one — suggests short-term weakness has already overtaken the longer trend. In plain language, that crossover often tells traders that rebounds may face selling pressure unless the stock can reclaim those averages.
The slope of the 20-day average is also negative, down -3.14% over 5 days, which means the trend is still leaning lower rather than flattening out. Price is not collapsing outright, but it is drifting under a declining ceiling. As shown in the chart, Alibaba is also trading near the bottom of its recent band, with support at HKD 106.90 and resistance at HKD 126.70. That places the stock only slightly above support and far from resistance.
A short line matters here: the market is still in repair mode.
Oscillators & Momentum
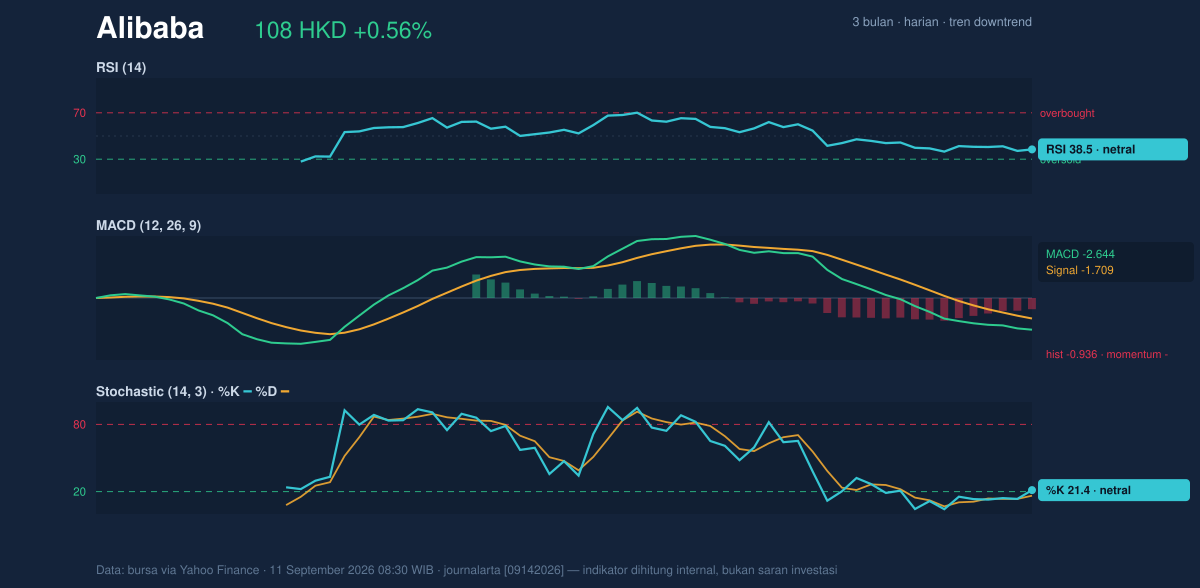
Momentum indicators are mixed on the surface but weak underneath. RSI(14) at 38.5 sits in neutral territory, but it is close enough to the lower zone to indicate buyers are not yet in full control. RSI is a speedometer for price strength; at this level, it does not scream oversold, but it does show the stock has not regained balance after the recent slide.
The stochastic oscillator is similarly subdued, with %K at 21.4 and %D at 16.3. That configuration can imply the stock is near an exhausted downside phase, but it is not a clean reversal signal on its own. What matters more is that the oscillator remains low while the broader trend is still negative. That combination says the shares may be compressed, but compression is not the same as recovery.
The clearest momentum message comes from MACD. MACD at -2.644, below the signal line at -1.709, leaves a negative histogram of -0.936. For readers, MACD is a trend-following tool: when it stays below the signal line, downside momentum is still stronger than upside momentum. As shown in the momentum chart, the indicator is not yet confirming a durable turn.
The setup is weak, not washed out.
Volatility & Volume
Bollinger Bands give a useful read on where price sits inside its recent volatility envelope. Alibaba is near the lower band, with %B at 22%, while the band structure shows upper at HKD 127.21, middle at HKD 114.52, and lower at HKD 101.83. A %B reading this low means the stock is positioned much closer to the lower edge than the center line, which often reflects persistent selling or a lack of buying conviction.
The band width is 22.2% and described as expanding, which signals higher volatility rather than a quiet consolidation. Expanding bands usually mean the market is preparing for larger swings, but they do not tell direction by themselves. Direction still has to come from price and momentum, and both currently lean soft.
Volume is not helping the bulls. The latest turnover of 56,226,973 shares is only 0.6× the 20-day average of 97,088,734, and OBV is declining. That combination matters because falling volume during weakness can sometimes suggest exhaustion, but falling on weak participation also means there is no strong evidence of accumulation. OBV, or on-balance volume, tracks whether volume is flowing into or out of the stock; here, it says money flow is still net negative.
ATR at 3.27, or about 3.0% of price, points to moderate day-to-day movement. So while the stock is not in a panic phase, it still has enough volatility to move quickly if support fails or if a rebound gathers force.
Key Levels & Scenarios
The nearest floor is HKD 106.90, which is also the 20-hour support level and sits just below the current price. That makes it the first line the market needs to defend. On the upside, the first meaningful hurdle is the middle Bollinger band and SMA20 at HKD 114.52, followed by SMA50 at HKD 115.10. Above that, the more obvious overhead barrier remains HKD 126.70.
The stock is trading at roughly the lower end of its 3-month range from HKD 88.65 to HKD 130.30, which means it is not at a multi-month extreme, but it is still far from proving a durable recovery. If price loses HKD 106.90, the next signal would be that the recent floor has given way while momentum remains negative. If it can reclaim HKD 114.52 and hold above HKD 115.10, the chart would start to look less fragile.
Technical Verdict: HOLD (wait & see)
HOLD (wait & see) fits best because the chart is still under pressure, but the stock is also close to support and momentum is not in a fully washed-out state.
- Reason 1: The trend remains negative, with price below SMA20 at HKD 114.52 and SMA50 at HKD 115.10, plus a death cross still in force.
- Reason 2: MACD is negative and below its signal line, showing downside momentum has not yet reversed.
- Reason 3: %B at 22% and price near HKD 106.90 support suggest the stock is compressed near the lower band, but volume remains light and OBV is falling, so confirmation is missing.
- Invalidation: this verdict is invalidated if price breaks below HKD 106.90.
- Ideal Entry Range: HKD 106.90 to HKD 114.52, where support and the Bollinger middle band/SMA20 cluster.
- Exit Target: HKD 115.10 to HKD 126.70, with the first test at SMA50 and the upper resistance zone beyond it.
- Stop Loss protection: below HKD 101.83, the lower Bollinger band.
For non-traders: the chart says Alibaba is still under pressure, but it is close enough to support that the next move could matter more than the last one.
The 3-month high is HKD 130.30.
Summary Data Alibaba
| Last price | 107.50 HKD |
| Change 1 day / 5 days / 1 month | 0.56% / -2.36% / -10.34% |
| Trend / MA-cross | downtrend / death |
| SMA20 / SMA50 | 114.52 / 115.10 |
| RSI (14) / Stochastic %K | 38.5 / 21.4 |
| Bollinger %B / ATR | 22% / 3.27 |
| Support / Resistance 20 days | 106.90 / 126.70 |
| Data as of | 11 September 2026 08:30 WIB |



