Singtel Testing Key Resistance: Stock Drops 0.44% (September 14, 2026)
On September 14, 2026: price 4.50 SGD, trend uptrend, RSI 53.1, support 4.40, resistance 4.56. technical analysis of singtel stock. Singtel Testing Key…

Singapore Telecom (Singtel) on SGX slipped to SGD 4.50 in the latest session, down from a SGD 4.52 previous close, even as the broader chart still points to an uptrend on the back of a rising SMA20, according to data from Yahoo Finance via SGX. The move is small, but it matters because it shows the share price is pausing near the middle of its recent range rather than breaking down, with the market still testing whether short-term momentum can extend beyond the current consolidation.
Trend & Price Action
The stock remains above both its SMA20 at SGD 4.49 and SMA50 at SGD 4.44, which keeps the structure constructive. That positioning tells traders the recent pullback has not yet damaged the larger trend, and the fact that price is only slightly above the 20-day average suggests the market is still deciding whether to continue higher or drift sideways.
There is no fresh moving-average crossover, so the chart is not flashing a new trend acceleration signal. Instead, the key message is steadiness: the price is above the short-term and medium-term averages, while the SMA20 slope is rising by 1.22% over 5 days, a sign that buyers have been willing to step in on dips. As shown in the chart, the share sits at about 63% of the 20-hour range, which is not stretched, but also not cheap enough to imply deep value support from a technical standpoint.
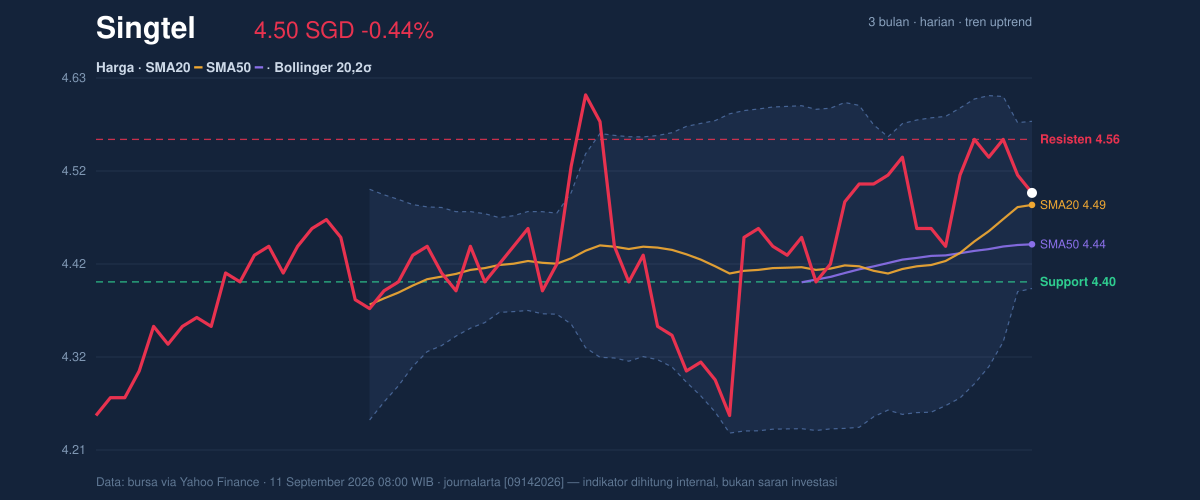
The nearest reference points are clear. Support at SGD 4.40 is the first line where demand has recently appeared, while resistance at SGD 4.56 marks the level the market must clear to show that the current pause is turning back into upward progress. The broader three-month range adds context: the stock is trading below the 3-month high of SGD 4.70 but above the 3-month low of SGD 4.19, which puts it in the upper half of its recent band without being in breakout territory.
Oscillators & Momentum
The momentum picture is mixed rather than emphatic. RSI at 53.1 is neutral, meaning the stock is neither overbought nor oversold, and that usually reflects balance rather than conviction. In plain language, the market is not showing signs of exhaustion, but it also is not displaying a strong rush of buying pressure.
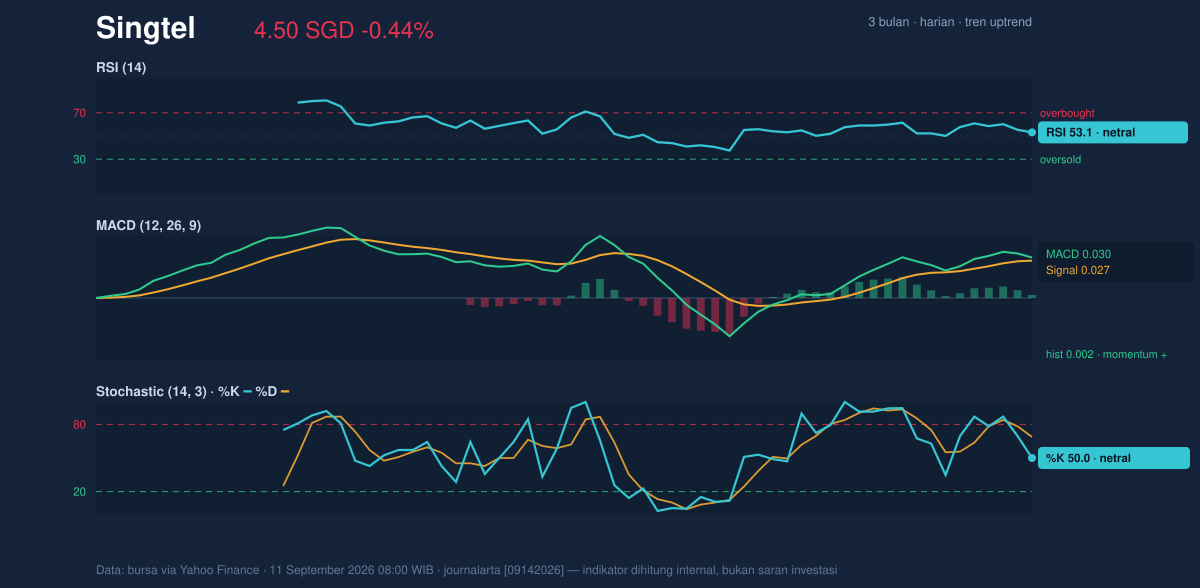
The stochastic oscillator reinforces that reading. Stochastic %K at 50.0 and %D at 68.8 are both neutral, but the gap between them suggests the faster line has cooled below the slower line, which often happens when a rally loses some short-term speed. That does not automatically signal reversal; it simply means the stock may need a fresh catalyst or a clean technical break to regain pace.
The more supportive piece is MACD at 0.030 versus a signal line at 0.027, with a histogram of 0.002. MACD is a trend-following measure, and a positive reading above the signal line indicates the underlying bias is still mildly upward. The small histogram, however, says that edge is thin. In other words, momentum is positive, but only just, so the chart is leaning constructive without being forceful.
Volatility & Volume
Bollinger Bands help explain why the share may be preparing for a larger move. The band width is just 4.2%, and that is described in the data as a squeeze. A squeeze means volatility has compressed, often before a directional break. The price is also sitting near the middle band at SGD 4.49, with %B at 57%, which shows the stock is slightly above the center of its volatility envelope but not near the upper edge at SGD 4.58. That combination usually points to a market waiting for confirmation rather than one already in a strong trend burst.
ATR, or average true range, stands at SGD 0.08, equal to 1.7% of price, which signals moderate volatility. For readers, that means the stock is moving enough to matter, but not enough to suggest disorderly trading. The volume picture is less supportive. Last volume was 16,984,200, below the 20-hour average of 18,770,698, or 0.9x normal, while OBV is falling. OBV, or on-balance volume, tracks whether money is flowing in or out; a decline there suggests the recent price stability has not yet been backed by strong accumulation. That is important because a squeeze without volume often stays a squeeze until participation improves.
Key Levels & Scenarios
The chart’s immediate decision zone is tight. A move above SGD 4.56 would put the stock into the resistance area and would be the first sign that the squeeze is resolving upward. If that fails, the market may continue to rotate around the SGD 4.49 middle band and the SGD 4.40 support area, where buyers have previously had a chance to defend the trend.
The signal to watch is whether price can hold above the moving averages while volume improves. Without that, the current setup can remain constructive but unconfirmed. With it, the stock would have a cleaner path toward the upper part of the recent range at SGD 4.70, which is the three-month high and the next obvious reference point on the chart.
Technical Verdict: HOLD (wait & see)
HOLD (wait & see)
- Why: the price is still above SMA20 and SMA50, which keeps the trend intact.
- Why: MACD is positive and above its signal line, so momentum is still mildly supportive.
- Why: the Bollinger Bands are in a squeeze, which often precedes a larger move, but volume is below average and OBV is falling, so confirmation is missing.
- Invalidation: the verdict weakens if price falls below SGD 4.40, the stated support.
- Ideal entry range: SGD 4.40 to SGD 4.49
- Exit target: SGD 4.56, with the next chart reference at SGD 4.70
- Stop loss protection: below SGD 4.40
For non-traders, this means the share is still holding its trend, but it has not yet shown enough strength to confirm the next leg higher.
Summary Data Singtel
| Last price | 4.50 SGD |
| Change 1 day / 5 days / 1 month | -0.44% / -0.44% / 1.12% |
| Trend / MA-cross | uptrend / none |
| SMA20 / SMA50 | 4.49 / 4.44 |
| RSI (14) / Stochastic %K | 53.1 / 50.0 |
| Bollinger %B / ATR | 57% / 0.08 |
| Support / Resistance 20 days | 4.40 / 4.56 |
| Data as of | 11 September 2026 08:00 WIB |


