PG Stock Gains 0.71% Today, Momentum Weakens
On Oktober 6, 2026: price 145.94 USD, trend sideways, RSI 49.6, support 142.64, resistance 149.03. technical analysis of pg stock. PG Stock Gains — full…
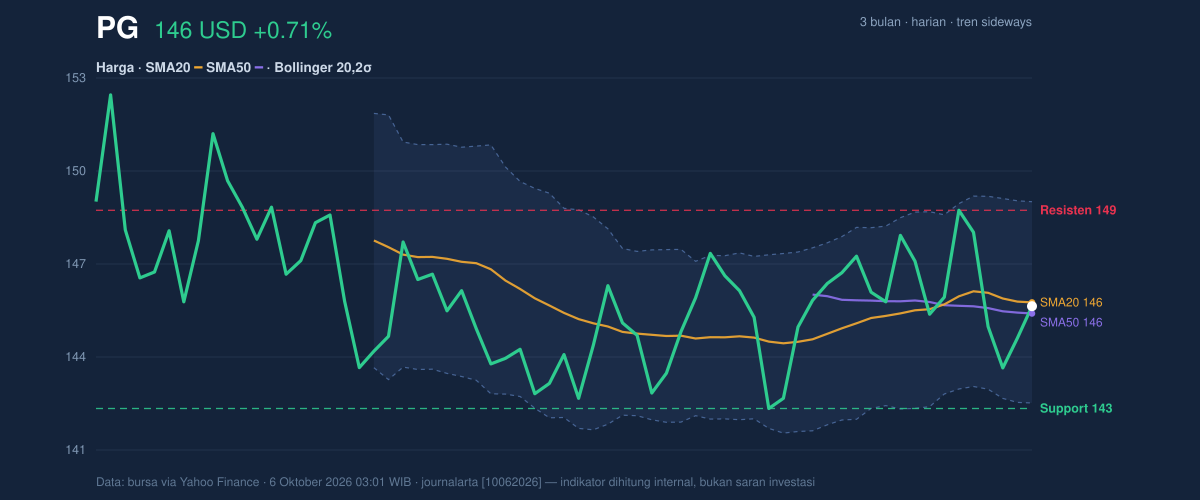
Procter & Gamble closed at $145.94 on Oct. 6, up 0.71% for the session but down 2.07% over five days, leaving the consumer-goods maker near the middle of its recent trading range. The exchange data supplied via Yahoo Finance show a market without a clear directional signal: the price is just below its 20-day average, slightly above its 50-day average, and trading volume is below its 20-day norm.
Trend & Price Action
The technical picture is broadly sideways. PG’s 20-day simple moving average, or SMA, is $146.06 and has eased 0.13% over five days; the 50-day SMA is $145.70. With the share price between those averages but beneath the shorter-term one, near-term momentum looks softer than the medium-term trend. There has been no new crossover, so neither a bullish “golden cross” nor a bearish “death cross” is confirming a change in direction.
PG sits at 52% of its 20-session range, between support at $142.64 and resistance at $149.03. That midpoint position offers little evidence that either side has control. The three-month high of $154.32 and low of $140.20 provide broader context: the latest price is well off the high, but remains above the period’s low.
The price is boxed in for now.
Oscillators & Momentum
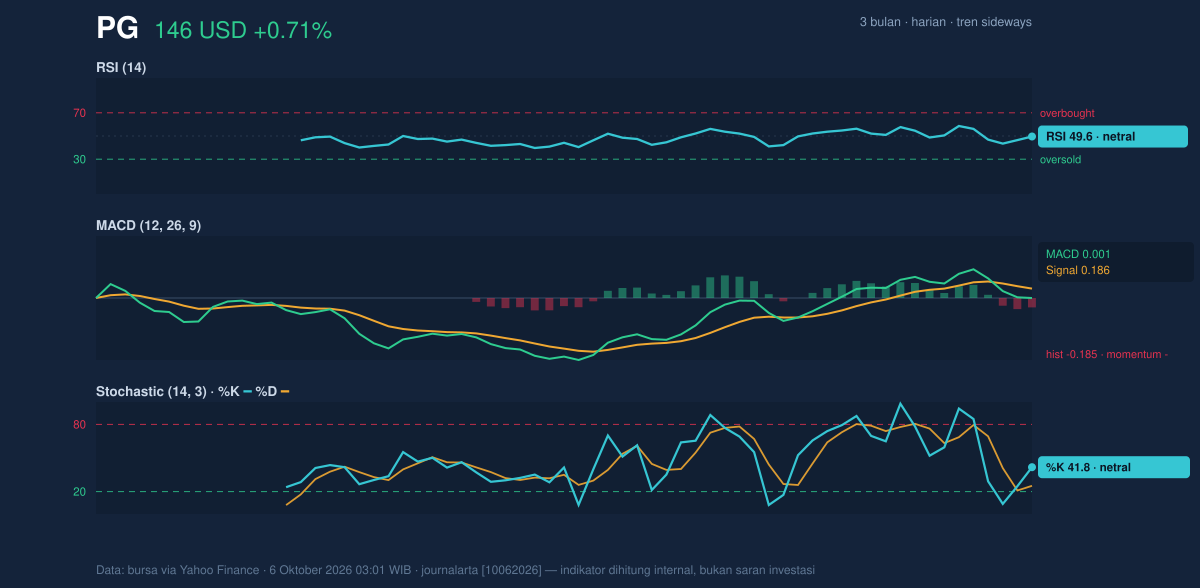
Momentum indicators reinforce the lack of a strong trend, but the MACD leans negative. The Relative Strength Index (RSI), which gauges the pace of recent gains and losses, is 49.6, a neutral reading. The Stochastic oscillator is also neutral, with %K at 41.8 and %D at 25.2; these readings do not show an extreme condition that would, by itself, point to an imminent reversal.
The Moving Average Convergence Divergence (MACD), a measure of trend momentum, is less supportive: its value is 0.001 against a signal line of 0.186, leaving a negative histogram of -0.185. In plain terms, the indicator says upward momentum is not keeping pace with its recent trend signal. That is a warning against reading the latest one-day gain as proof of a durable advance, especially with OBV—on-balance volume, which tracks whether trading volume tends to accompany buying or selling—falling.
Volatility, Volume & Key Levels
Bollinger Bands, which expand or contract with price volatility, are narrowing: their width is 4.4%, with the upper band at $149.31 and the lower band at $142.82. The share price’s position at 48% of the band is close to its midpoint, not near an outer boundary. The squeeze signals subdued volatility and the possibility of a larger move, but does not indicate its direction. Average True Range (ATR), a measure of typical daily movement, is $2.17, or 1.5% of the price, consistent with relatively low volatility.
Participation has been light. Latest volume of 7,036,500 shares was 0.9 times the 20-day average of 8,057,510, while OBV is declining. Together, those measures provide little confirmation that buyers are accumulating shares. A move above $149.03 resistance would challenge the range ceiling; failure to hold $142.64 support would instead put the lower Bollinger Band at $142.82 and the three-month low of $140.20 in focus.
Technical Verdict: HOLD
HOLD (wait & see) is the clearest reading of the mixed signals. The price remains between its 20-day and 50-day averages with no new crossover; RSI and Stochastic are neutral; and the MACD histogram is negative while volume and OBV do not confirm strong buying. The verdict is invalidated if price falls below $142.64, the stated 20-session support.
- Ideal entry range: $142.64–$146.06, bounded by 20-session support and the 20-day SMA.
- Exit target: $149.03, the 20-session resistance.
- Stop-loss protection: below $142.64, using the stated support as the level that would undermine the range-bound setup.
For non-traders, HOLD means the indicators show neither a convincing upward trend nor a confirmed breakdown.
Summary Data PG
| Last price | 145.94 USD |
| Change 1 day / 5 days / 1 month | 0.71% / -2.07% / -0.34% |
| Trend / MA-cross | sideways / none |
| SMA20 / SMA50 | 146.06 / 145.70 |
| RSI (14) / Stochastic %K | 49.6 / 41.8 |
| Bollinger %B / ATR | 48% / 2.17 |
| Support / Resistance 20 days | 142.64 / 149.03 |
| Data as of | 6 Oktober 2026 03:01 WIB |
Track PG stock price daily: live levels, support/resistance and our full PG analysis history.