Shell Stock Gains 0.54% on Tuesday, Testing Key Resistance
On October 6, 2026: price 3,651.00 GBp, trend uptrend, RSI 63.0, support 3,488.50, resistance 3,654.50. technical analysis of shell stock.

Shell plc rose 0.54% to 3,651.00 GBp on the London Stock Exchange, leaving the energy major close to its recent trading ceiling as its short-term upward trend meets signs of fading momentum. The share gained 1.59% over five days and 4.30% over one month, but thin trading and an overbought short-term oscillator make the advance less firmly confirmed than the price rise alone suggests.
Trend & Price Action
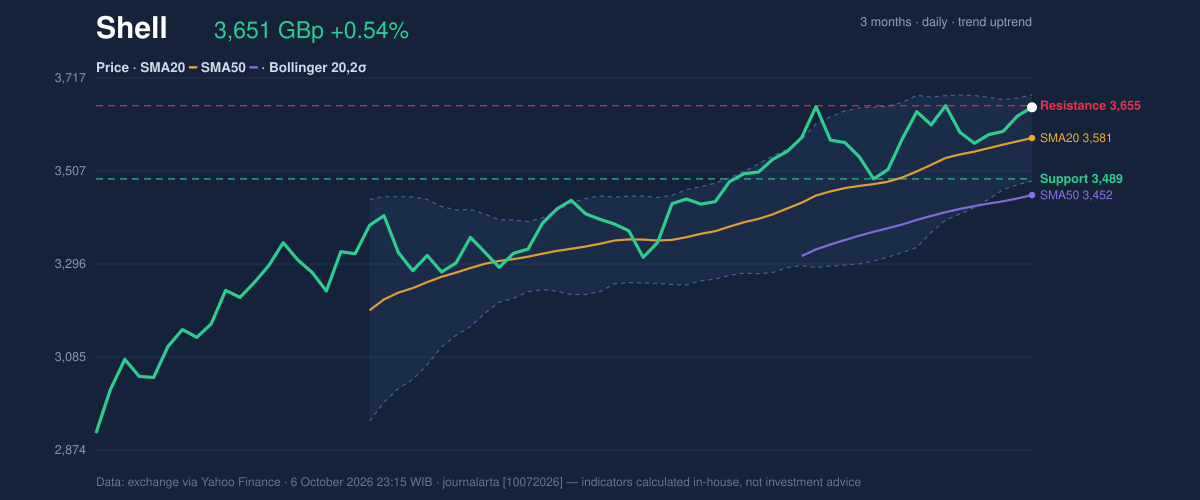
Shell’s share price is above both its 20-day simple moving average (SMA) at 3,581.28 and its 50-day SMA at 3,451.90. The 20-day average is rising, with a 1.05% slope over five days, a pattern consistent with an established uptrend. There has been no new moving-average crossover, however, so the data show continuation rather than a fresh bullish signal.
The price is also approaching the 20-day resistance at 3,654.50 and sits at 98% of its recent range. That location matters: gains may continue, but the share has little room before it tests a level where sellers have previously emerged. Shell’s three-month high is 3,681.50; the supplied low of 0.00 is not a usable reference for assessing the range.
As shown in the chart, the price is near the upper Bollinger Band at 3,678.93. Bollinger Bands track price relative to recent volatility; a reading near the upper band signals strength, but can also mean the share is stretched. The band width is narrowing at 5.5%, a squeeze that often precedes a larger move without indicating its direction. The combination of an uptrend and a narrowing band points to a potential breakout, not confirmation that one has occurred.
Oscillators & Momentum
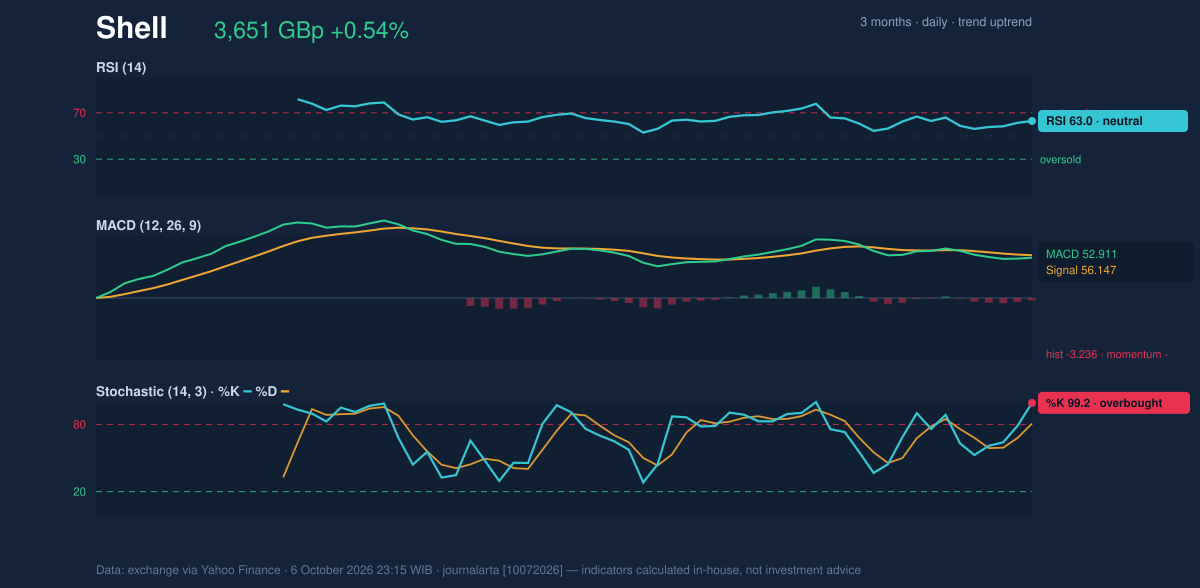
The momentum measures are mixed. The Relative Strength Index (RSI), which gauges the pace of recent gains and losses, stands at 63.0, a neutral reading rather than an extreme. Stochastic %K is 99.2 and %D is 80.7; both are high, with %K in overbought territory. This suggests the share has risen sharply within its recent range and may be vulnerable to a pause or pullback.
The Moving Average Convergence Divergence (MACD) also tempers the bullish price picture. Its reading of 52.911 is below the signal line at 56.147, leaving a negative histogram of -3.236. In plain terms, the share remains in an upward trend, but this indicator says its upward momentum is weakening. Stochastic is overbought, while MACD momentum is negative—a divergence in tone that argues against treating the latest gain as a decisive acceleration.
Volatility & Volume
Average True Range (ATR), a measure of typical price movement, is 321.82 GBp, equivalent to 8.8% of the share price. That is high volatility: moves can be wide, so nearby technical levels may be tested quickly and short-term signals can reverse abruptly.
Volume provides limited confirmation of the rise. The latest session saw 7,420,650 shares traded, about 0.7 times the 20-day average of 10,183,165. Lower-than-usual activity can mean fewer market participants are backing the advance. On the other hand, On-Balance Volume (OBV), which tracks whether volume is flowing more on rising or falling sessions, is increasing. Rising OBV is supportive, but below-average turnover weakens the evidence behind the price gain.
Key Levels & Scenarios
The immediate test is resistance at 3,654.50, with the upper Bollinger Band at 3,678.93 and the three-month high at 3,681.50 forming nearby hurdles. A sustained move above that area would strengthen the breakout case, particularly if trading activity improves. Failure to clear resistance could leave the share consolidating after its recent advance.
On the downside, the 20-day support at 3,488.50 is close to the lower Bollinger Band at 3,483.62. A fall through that zone would weaken the short-term structure; below it, the 50-day SMA at 3,451.90 is another reference point. The 20-day SMA at 3,581.28 sits between current price and support and may help indicate whether a pullback remains contained.
Technical Verdict: HOLD (wait & see)
HOLD (wait & see) reflects the conflict between a rising trend and softer short-term momentum.
- Reasons: price is above rising SMA20 and SMA50; narrowing Bollinger Bands leave room for a larger move; but overbought Stochastic, negative MACD momentum and below-average volume limit confirmation.
- Invalidation: this verdict is invalidated if price falls below the 20-day support at 3,488.50.
- Ideal Entry Range: 3,581.28–3,488.50, framed by SMA20 and 20-day support.
- Exit Target: 3,678.93–3,681.50, at the upper Bollinger Band and three-month high.
- Stop Loss: below 3,483.62, the lower Bollinger Band.
For non-traders, the chart still leans upward, but the signals are not aligned enough to show that the next move is likely to extend the rally.
Summary Data Shell
| Last price | 3,651.00 GBp |
| Change 1 day / 5 days / 1 month | 0.54% / 1.59% / 4.30% |
| Trend / MA-cross | uptrend / none |
| SMA20 / SMA50 | 3,581.28 / 3,451.90 |
| RSI (14) / Stochastic %K | 63.0 / 99.2 |
| Bollinger %B / ATR | 86% / 321.82 |
| Support / Resistance 20 days | 3,488.50 / 3,654.50 |
| Data as of | 6 October 2026 23:15 WIB |
Track Shell share price daily: live levels, support/resistance and our full Shell analysis history.