Tencent Stock Analysis: Gains 1.23%, Momentum Weakens
On October 6, 2026: price 428.20 HKD, trend downtrend, RSI 45.4, support 419.00, resistance 451.60. technical analysis of tencent stock.
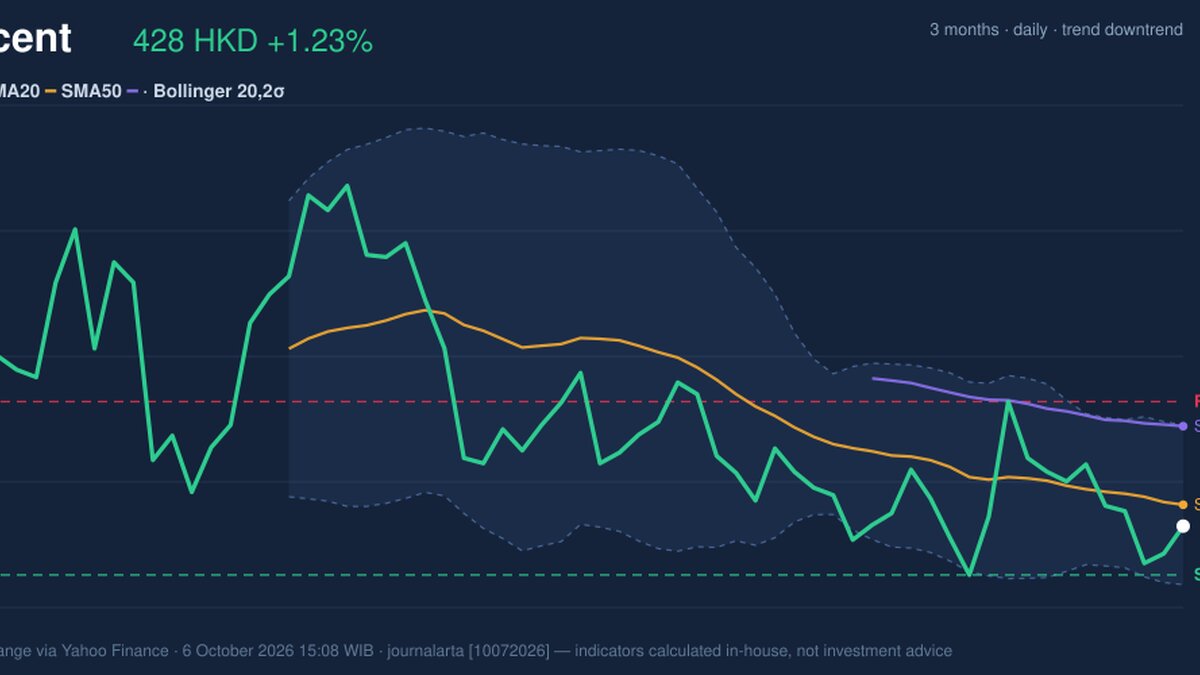
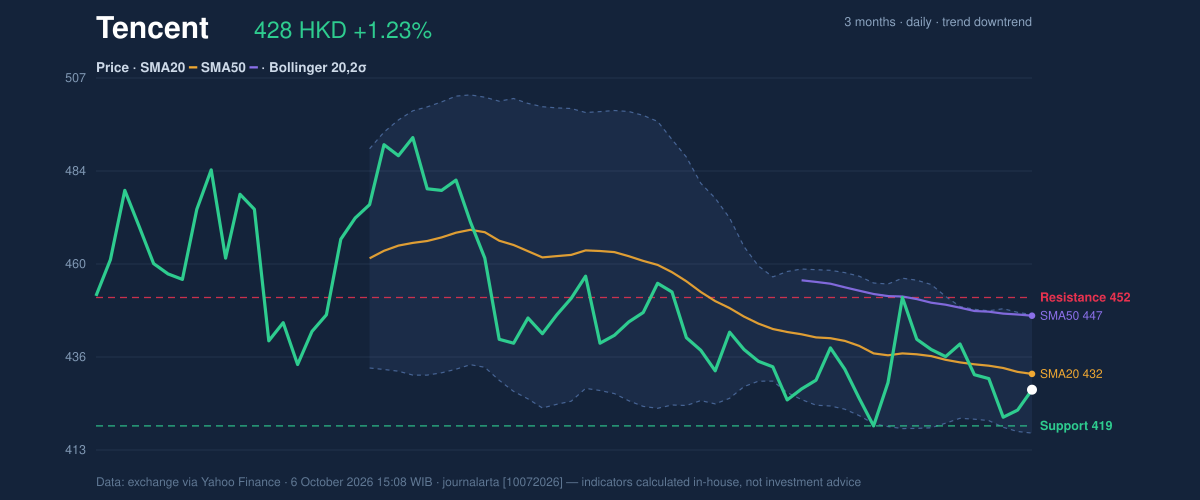
Tencent Holdings rose 1.23% to HK$428.20 on the Hong Kong Stock Exchange on October 6, recovering from the previous close even as its short-term trend remained downward. The share price was still below its 20-day and 50-day moving averages, while falling on thin volume over the past five trading days. That combination points to a rebound that has yet to show broad participation.
Trend & Price Action
Tencent’s latest gain came after declines of 2.64% over five days and 2.33% over one month, according to market data from the exchange via Yahoo Finance. At HK$428.20, the stock sat below its SMA20 of HK$432.20 and SMA50 of HK$446.98. The 20-day average was also sloping down, a sign that the recent price weakness is not simply a one-day fluctuation. There was no new moving-average crossover, so the data offer no fresh signal that the prevailing trend has changed.
The daily bounce has not yet reclaimed the short-term trend line.
The stock stood in the lower portion of its recent trading range: the 20-day support and resistance span was HK$419.00 to HK$451.60, with price at 28% of that range. Its three-month high and low were HK$497.80 and HK$416.40. The proximity to the low makes the support zone important; a hold there could stabilise the chart, while a break below it would put the three-month low back in focus.
Oscillators & Momentum
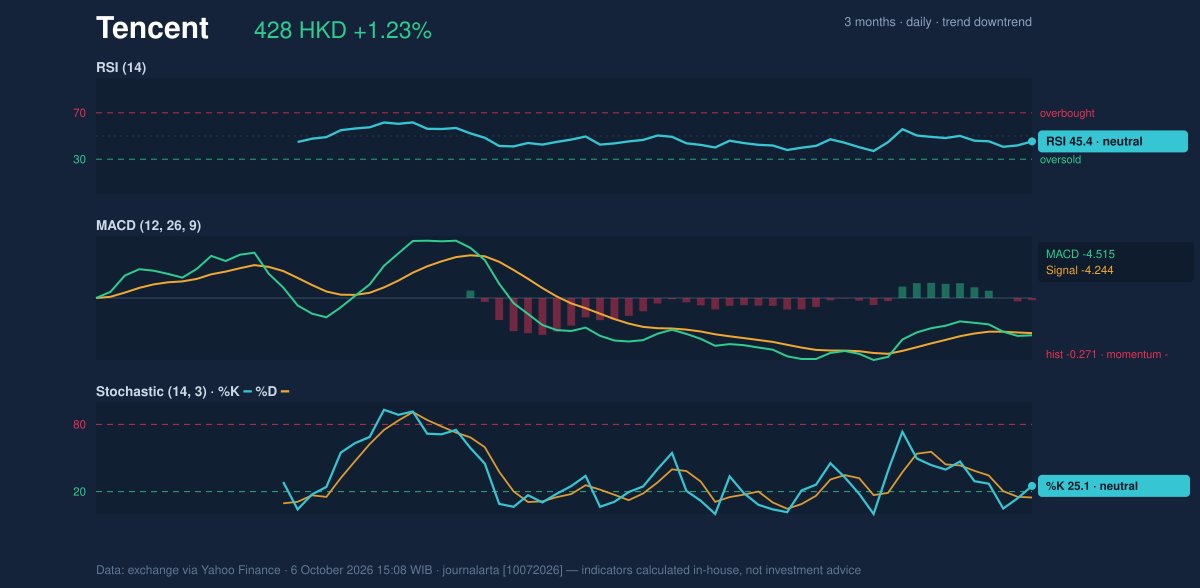
Momentum readings are mixed rather than decisively bullish. The RSI at 45.4 is neutral, meaning recent gains and losses are relatively balanced, but the indicator remains below the midpoint commonly used to distinguish stronger positive momentum. The Stochastic readings—%K at 25.1 and %D at 14.7, both neutral—sit low in their recent range, suggesting the stock has been weak without confirming a clear reversal.
The MACD reinforces that caution: MACD at -4.515 is below its -4.244 signal line, and the negative histogram of -0.271 indicates that downward momentum remains in place. The gap is not, by itself, proof of a further decline; it does show that the latest price rise has not yet turned the momentum measure positive.
Volatility & Volume
Tencent’s Bollinger Bands are narrowing, with a width of 7.0%, a pattern often called a squeeze. Narrow bands indicate that recent price swings have contracted and that a larger move may follow, but they do not reveal its direction. The share’s %B reading of 37% places it below the bands’ midpoint, consistent with a price still closer to the lower band than the upper one. The lower band at HK$417.17 also sits near the 20-day support of HK$419.00, making that area a technical test.
Average true range, a measure of typical price movement, was HK$11.20, or 2.6% of the share price—moderate volatility by this reading. Meanwhile, trading volume was 10,030,081 shares, about half the 20-day average of 19,338,527. On-balance volume, which tracks whether trading volume tends to accompany rises or falls, was also declining. Thin turnover and falling OBV weaken the case that the rebound reflects strong investor demand.
Technical Verdict: HOLD
The indicator mix supports a wait-and-see reading: the price remains below both moving averages, MACD momentum is negative, and declining OBV with below-average volume offers little confirmation of the one-day rise. The narrowing Bollinger Bands, however, leave room for a sharper move in either direction.
- Illustrative entry range: HK$419.00–HK$432.20, bounded by 20-day support and the SMA20.
- Illustrative exit target: HK$451.60, the 20-day resistance level.
- Illustrative stop-loss protection: HK$417.17, the lower Bollinger Band.
This verdict is invalidated if the price falls below HK$419.00 support.
In plain English, the chart has not yet shown whether the latest bounce can overcome the broader short-term weakness.
Data source: Hong Kong exchange data via Yahoo Finance, as of October 6, 2026, 15:08 WIB. This is technical analysis, not an investment recommendation.
Summary Data Tencent
| Last price | 428.20 HKD |
| Change 1 day / 5 days / 1 month | 1.23% / -2.64% / -2.33% |
| Trend / MA-cross | downtrend / none |
| SMA20 / SMA50 | 432.20 / 446.98 |
| RSI (14) / Stochastic %K | 45.4 / 25.1 |
| Bollinger %B / ATR | 37% / 11.20 |
| Support / Resistance 20 days | 419.00 / 451.60 |
| Data as of | 6 October 2026 15:08 WIB |
Track Tencent share price daily: live levels, support/resistance and our full Tencent analysis history.