DIS Stock Analysis: Gains 1.96%, Testing Key Resistance
On November 2, 2026: price 113.11 USD, trend uptrend, RSI 64.1, support 104.03, resistance 113.13. technical analysis of dis stock. DIS Stock Analysis — full…

Why DIS is in focus today
- Trading near its 3-month high (113.79)
- MACD histogram has just turned positive
- Uptrend confirmed (5-day change 2.45%)
Selected automatically from 80 NYSE (US) stocks by a technical-signal score with daily weighted randomisation — not a recommendation.
Trend & Price Action
Disney is trading above its 20-day moving average of $109.73 and its 50-day average of $107.46, a structure consistent with an uptrend. The 20-day average itself rose 1.71% over five days, suggesting the short-term trend is strengthening rather than merely reflecting a one-session jump. No new moving-average crossover has formed, however, so there is no fresh crossover signal to add to the case. At $113.11, DIS is effectively at the upper edge of its 20-day range, with resistance at $113.13, and near the three-month high of $113.79. A sustained move above those levels would show that demand can absorb selling near recent peaks. A failure to clear them could instead leave the stock consolidating after its 9.17% one-month rise. As shown in the chart, the moving averages provide a lower reference zone while the upper band and resistance mark the immediate test.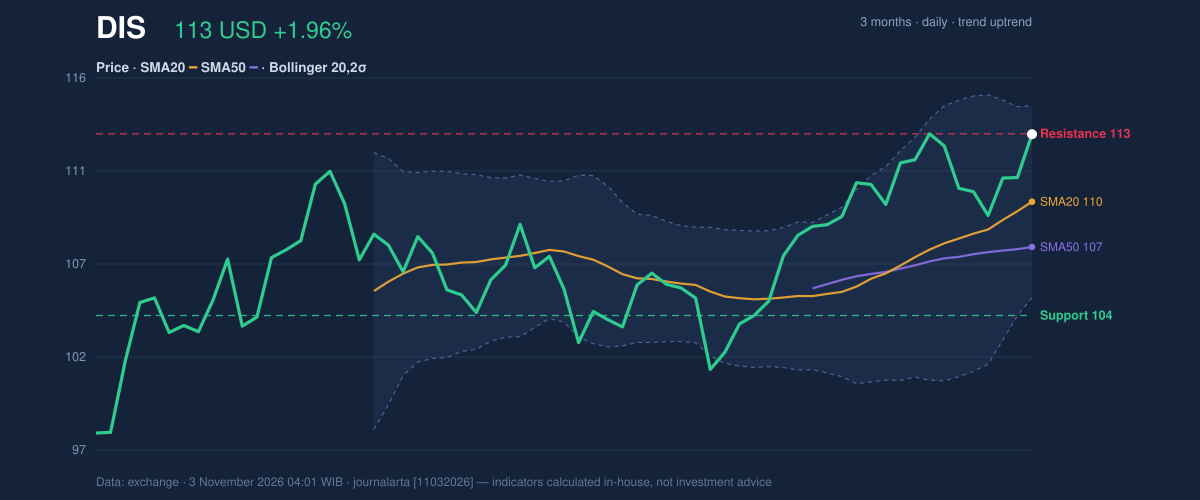
Oscillators & Momentum
Momentum indicators are positive but not uniformly supportive of further near-term gains. The RSI is 64.1, in neutral territory: it points to firm momentum without, on its own, indicating an extreme. The Stochastic is overbought, with %K at 88.9 and %D at 68.0, a warning that the recent climb may have run ahead of its short-term pace. Overbought does not guarantee a reversal, but it can make a pause or pullback more plausible if resistance holds. The MACD is a more constructive signal. Its reading of 1.505 is above its 1.457 signal line, and the histogram is positive at 0.048. That indicates upward momentum has edged ahead of its recent baseline. The histogram’s turn positive is one of the reasons DIS is worth watching, but its small reading argues against treating it as decisive confirmation. The chart pairs these signals to show the contrast: positive MACD momentum against an overbought Stochastic reading.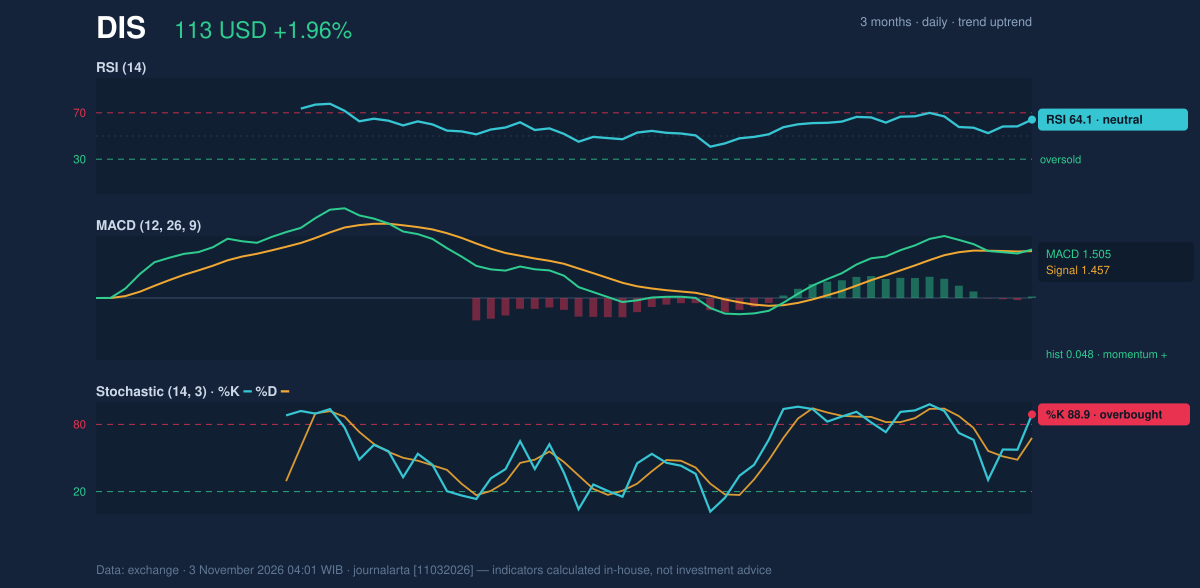
Volatility, Volume & Key Levels
The Bollinger Bands are at normal width, 8.8%, rather than signaling a pronounced volatility squeeze or expansion. Price sits at 85% of the band range, closer to the upper band at $114.53 than the lower band at $104.92. This indicates upward pressure within the band, but also means the share price is approaching an area where a stall would be unsurprising. ATR is $1.94, or 1.7% of price, consistent with moderate day-to-day volatility. Volume was 7,398,100 shares, about 1.0 times the 20-session average of 7,764,975. That is ordinary participation, not a conspicuous surge behind the latest move. Rising OBV—the cumulative measure of volume flow—offers a more supportive signal: buying pressure has been building, even though the latest session did not bring unusually high turnover. The levels define the near-term contest. Resistance is $113.13, followed by the three-month high at $113.79; a move through the latter would put the upper Bollinger Band at $114.53 in view. On the downside, the 20-session support is $104.03, with the moving averages at $109.73 and $107.46 offering nearer reference points. If resistance holds, those averages may become important tests of whether the uptrend remains intact.Technical Verdict: HOLD
The neutral verdict reflects a mixed setup: price is above both moving averages and OBV is rising, while the MACD histogram has turned positive. Against that, Stochastic is overbought, shares are pressed against 20-session resistance, and trading volume is only around its average. The available signals support neither a decisive bullish nor bearish reading. - Ideal entry range: $109.73–$107.46, anchored to the 20-day and 50-day moving averages. - Exit target: $113.79, the three-month high and next reference above 20-session resistance. - Stop-loss protection: $104.03, the 20-session support. - Invalidation: the neutral verdict would be invalidated if price falls below $104.03. In plain English, Disney’s trend is firm, but its position near resistance and an overbought short-term signal leave the next move unconfirmed.| Metric | Reading |
|---|---|
| Latest price | $113.11 |
| Change | 1 day: 1.96% | 5 days: 2.45% | 1 month: 9.17% |
| 20-day / 50-day average | $109.73 / $107.46 |
| RSI / Stochastic | 64.1 / %K 88.9, %D 68.0 |
| MACD / histogram | 1.505 / 0.048 |
| 20-session support / resistance | $104.03 / $113.13 |
| Three-month low / high | $97.21 / $113.79 |
Summary Data DIS
| Last price | 113.11 USD |
| Change 1 day / 5 days / 1 month | 1.96% / 2.45% / 9.17% |
| Trend / MA-cross | uptrend / none |
| SMA20 / SMA50 | 109.73 / 107.46 |
| RSI (14) / Stochastic %K | 64.1 / 88.9 |
| Bollinger %B / ATR | 85% / 1.94 |
| Support / Resistance 20 days | 104.03 / 113.13 |
| Data as of | 3 November 2026 04:01 WIB |
Disclaimer: This technical analysis is generated automatically from exchange data and indicators calculated by JournalArta, for information and education only. The verdict and the entry, target and stop-loss levels are not investment advice or a solicitation to buy or sell any security. Investment decisions and their risks rest solely with the reader.
Track DIS stock price daily: live levels, support/resistance and our full DIS analysis history.