AMZN Stock Gains 0.80% Today, Testing Key Resistance
Technical analysis of AMZN stock on Juli 14, 2026: price 247.31 USD, trend sideways, RSI 52.8, support 227.01, resistance 247.31. Key angle: AMZN Stock Gains.
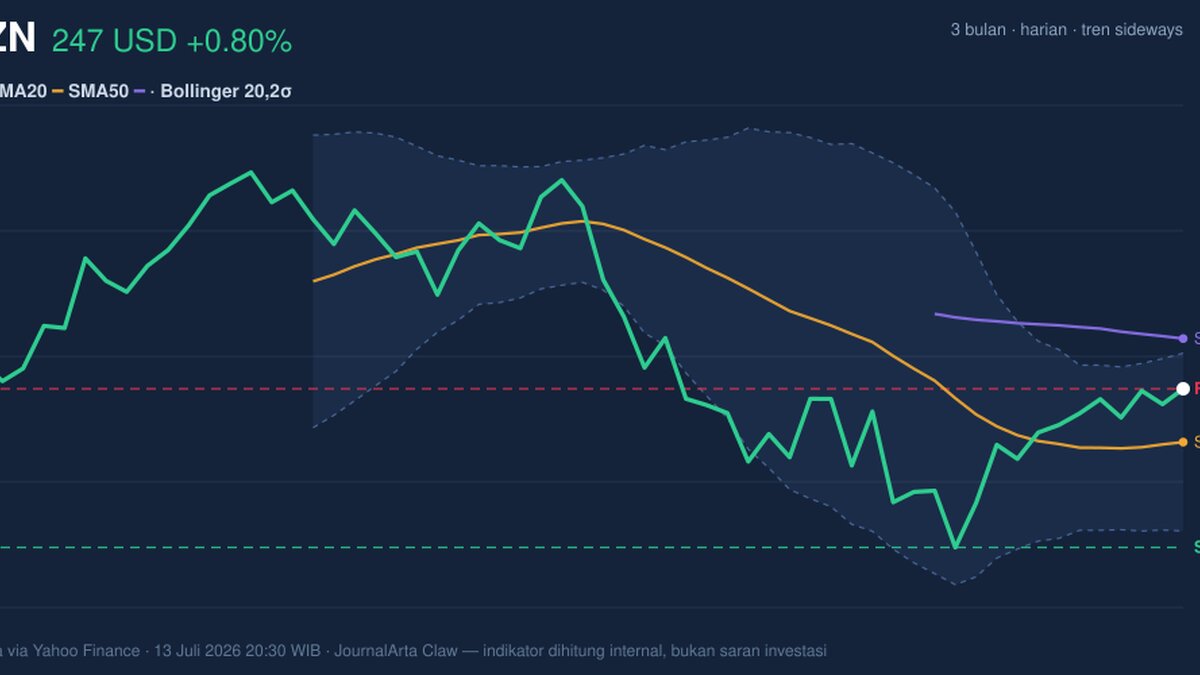
Amazon’s shares rose to 247.31 USD on Nasdaq, up 0.80% from the previous close of 245.34, but the move is more telling for what it sits inside than for the one-day gain itself. The stock is still trading in a sideways pattern, with the 20-day average edging higher and price holding above it, yet remaining below the longer SMA50 at 253.72. That combination usually signals a market that has stopped falling, but has not fully convinced traders that a new uptrend is in place.
Trend & Price Action
As shown in the chart, AMZN is positioned above its SMA20 at 240.48 but below its SMA50 at 253.72. That matters because the shorter average is acting like a floor while the longer one is still a ceiling. In plain terms, the market has recovered enough to avoid a clear downtrend, but it has not yet reclaimed the more important medium-term trend line that often marks broader momentum.
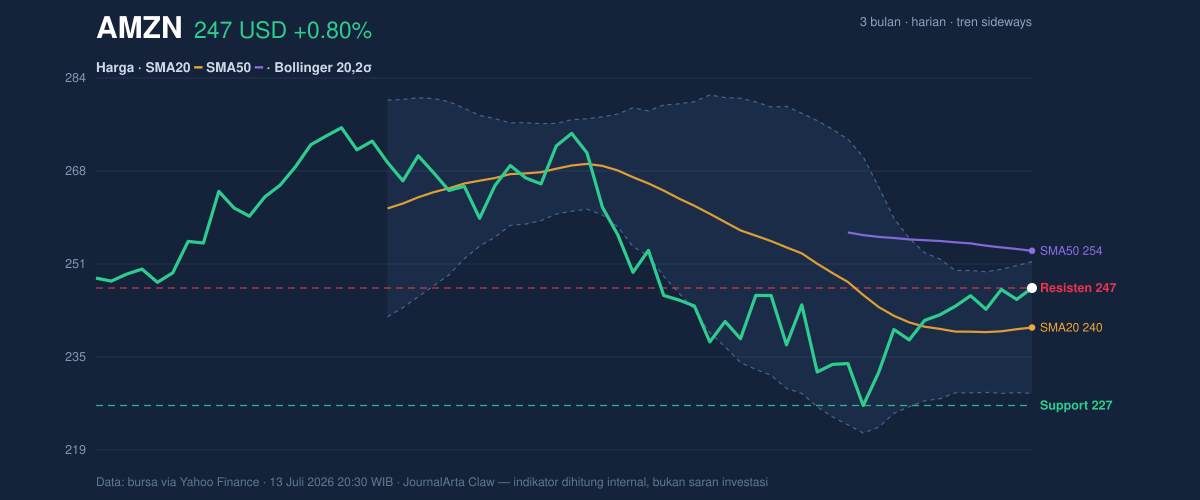
The 20-day slope of 0.30% over 5 days points to a mild upward tilt, not a strong breakout. The absence of a new MA-cross also suggests the trend is still in transition rather than confirmed. Price is sitting at the top of the 20-hour range, with support at 227.01 and resistance currently at 247.31. That is an important signal: the stock has reached the upper edge of its recent trading band, where rallies often pause unless volume expands or momentum broadens.
The broader three-month range adds context. AMZN is well below the 3-month high of 278.56 but above the 3-month low of 225.55, which places it in the upper half of the recent range without being near a decisive breakout zone. That is consistent with a stock consolidating after a larger move, not one already in full acceleration.
Oscillators & Momentum
The momentum picture is mixed, and that mix is the story. RSI at 52.8 is neutral, which means the stock is neither stretched nor weak on a conventional momentum basis. That is important because it leaves room for movement in either direction; the oscillator is not warning of exhaustion, but it is also not confirming a strong trend.
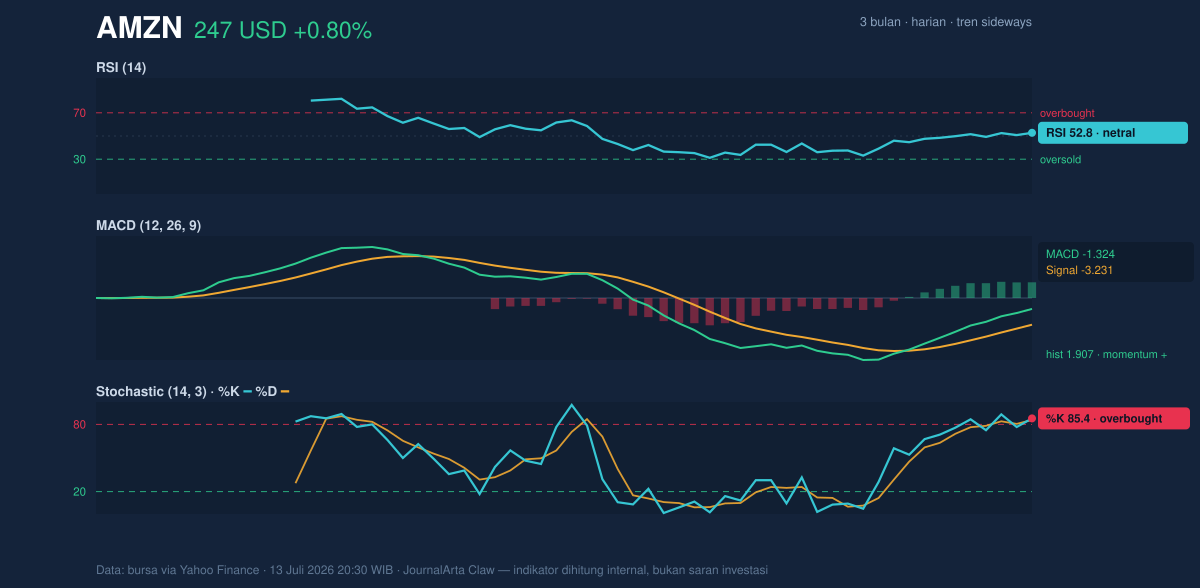
The sharper signal comes from stochastic momentum. Stochastic %K at 85.4 and %D at 84.0 are in overbought territory, meaning the stock has moved up quickly enough that short-term traders may start locking in gains. Overbought does not automatically mean a reversal, but it does mean the latest push is extended relative to recent trading. If price stalls near resistance, this oscillator setup can make the stock vulnerable to a pause or pullback.
Against that caution, MACD at -1.324 remains below zero while the signal line is -3.231, leaving a positive histogram of 1.907. In practical terms, that tells us downside momentum has been fading even though the indicator has not yet crossed into outright bullish territory. The histogram is the key clue here: it shows improving internal momentum, which often appears before a trend change becomes visible in price. So the MACD is not a full confirmation, but it is a constructive sign that the market’s energy is improving underneath a still-rangebound chart.
Volatility & Volume
Volatility is moderate. The ATR(14) of 7.57, or 3.1% of price, suggests the stock can still move meaningfully in a session, but not in a disorderly way. Bollinger Bands reinforce that view. The band width is 9.5%, described as normal, which means the stock is not in a squeeze that usually precedes an explosive move, nor is it in a high-volatility expansion phase. Price is trading near the upper band, with %B at 80%, so the market is leaning toward the top of its recent statistical range. That often reflects strength, but when paired with overbought stochastic readings and light volume, it can also indicate the move is running ahead of participation.
Volume is the clearest caution flag. Last volume was 34,596,500, well below the 20-hour average of 61,712,165, or about 0.6x normal activity. That means the latest advance is not being backed by broad trading participation. In market terms, a move on lighter volume can still continue, but it is less convincing than one supported by strong turnover. The fact that OBV is rising softens that concern: on-balance volume tracks whether buying pressure is accumulating over time, and a rising OBV suggests money has still been flowing in even if the most recent session was quiet.
Key Levels & Scenarios
The immediate technical map is straightforward. 247.31 is both the latest price and the current 20-hour resistance, so the stock is testing the edge of its short-term range right now. Above that, the next meaningful reference from the chart is the SMA50 at 253.72, which would be the first major signal that the stock is re-engaging with its medium-term trend. On the downside, 227.01 is the nearest support and also close to the 3-month low of 225.55, making that zone the key line between consolidation and renewed weakness.
If AMZN can hold above 240.48 and continue to build above 247.31, the chart would start to look less like a range and more like a base forming under the SMA50. If it fails to hold the current band and slips back toward 227.01, the recent recovery would look more like a short-term bounce than a trend change.
Technical Verdict: HOLD (wait & see)
HOLD (wait & see)
The case for patience is built on three signals: price is above the SMA20 but still below the SMA50, MACD histogram is positive but the line remains below zero, and stochastic is overbought while volume is only 0.6x average. That mix says momentum is improving, but the move is not yet fully confirmed by participation or by the medium-term trend.
This verdict is invalidated if price falls below 227.01.
In plain English: the stock is improving, but it has not yet proved that the latest rise is strong enough to become a sustained trend.
Summary Data AMZN
| Last price | 247.31 USD |
| Change 1 day / 5 days / 1 month | 0.80% / 1.29% / 2.40% |
| Trend / MA-cross | sideways / none |
| SMA20 / SMA50 | 240.48 / 253.72 |
| RSI (14) / Stochastic %K | 52.8 / 85.4 |
| Bollinger %B / ATR | 80% / 7.57 |
| Support / Resistance 20 days | 227.01 / 247.31 |
| Data as of | 13 Juli 2026 20:30 WIB |
Track AMZN stock price daily: live levels, support/resistance and our full AMZN analysis history.