KO Stock Gains 0.91% Today, Testing Key Resistance
Technical analysis of KO stock on Juli 14, 2026: price 84.25 USD, trend uptrend, RSI 60.6, support 79.39, resistance 84.25. Key angle: KO Stock Gains.
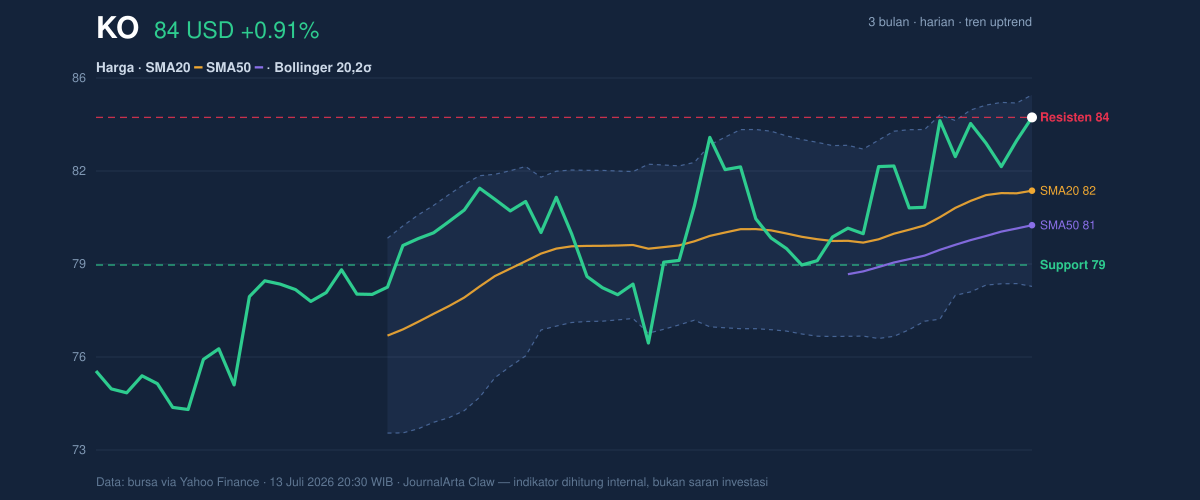
At USD 84.25, Coca-Cola (NYSE: KO) is pressing against its near-term ceiling after a 0.91% one-day rise, with the stock now sitting at the top of its 20-day range and just under the upper Bollinger Band at 84.99. The move matters less as a headline gain than as a test of whether a steady defensive name can convert a gradual climb into a cleaner breakout. As shown in the chart, price is trading above both the SMA20 at 81.84 and the SMA50 at 80.70, which keeps the short-term structure constructive even though the latest advance has been made on lighter participation.
Trend & Price Action
KO’s trend remains pointed higher, helped by the SMA20 slope of 0.70% over 5 days. That slope is important because it shows the recent average price is still rising, not merely flatting out after a bounce. The stock is also above the SMA50, which tells traders the recovery is not just a one-day event but part of a broader medium-term drift upward. There is no new moving-average cross, so this is not a fresh signal from the averages themselves; instead, the market is reading the existing alignment as confirmation that momentum has stayed intact.
The current price is effectively at the top of the recent band, with support at 79.39 and resistance at 84.25 in the 20-day range. That positioning is meaningful: when a stock closes at the upper edge of its range, it often means buyers have been willing to pay progressively higher prices, but it also leaves less room for complacency. The chart shows KO has already reached its 3-month high of 85.68, so the next leg is less about trend discovery and more about whether the market can sustain pressure near a prior peak.
What stands out here is the lack of urgency in the tape. KO is climbing, but not explosively. That usually suits a consumer staple name: the move is orderly, and the technical picture is more about accumulation than speculation.
Oscillators & Momentum
Momentum indicators are supportive, but not stretched enough to scream exhaustion. The RSI at 60.6 sits in neutral territory, which is important because it says the stock has room to continue higher without immediately looking overbought. The Stochastic %K at 75.6 and %D at 66.2 lean firmer, indicating price is near the upper part of its recent trading band, but still not in a classic reversal zone. In plain English: momentum is positive, but it has not yet become overheated.
The MACD at 0.977 remains above its signal line at 0.806, with a positive histogram of 0.171. That combination matters because MACD is often read as a measure of trend acceleration. When the main line stays above the signal line and the histogram is positive, it suggests buyers still have the edge, even if that edge is modest. The message from the oscillator set is consistent: KO is advancing with support from trend-following momentum, but the move is measured rather than euphoric.
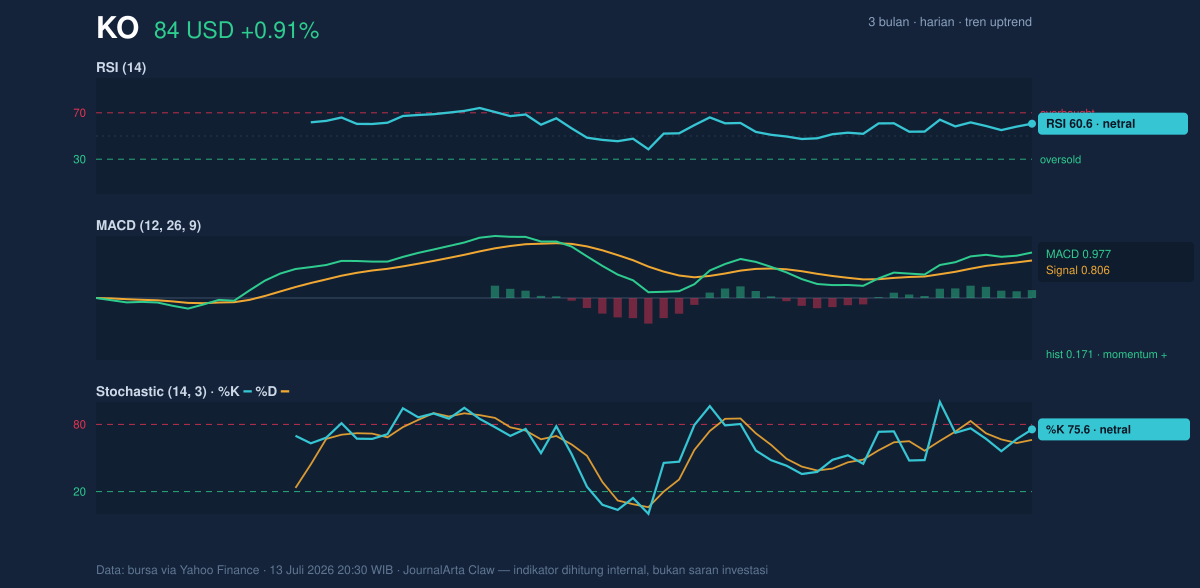
The key nuance is that the oscillators are aligned with the trend, not racing ahead of it. That reduces the chance of a sharp technical snapback, but it also means the stock may need a fresh catalyst to push decisively beyond the current ceiling.
Volatility & Volume
Volatility is moderate, with ATR(14) at 1.75, equal to 2.1% of price. For a company like Coca-Cola, that is enough movement to matter, but not enough to imply disorder. More interesting is the Bollinger setup: the bands are relatively tight, with 7.7% width, described in the data as a squeeze. A squeeze often signals that price has been compressing and may be preparing for a stronger move. Because KO is already near the upper band and near resistance, the squeeze tilts the next move toward a possible upward break — but only if buyers prove they can keep volume behind the move.
That is where the volume picture complicates the story. Recent volume was 12,058,600, below the 20-day average of 20,118,365, or about 0.6x normal. Light volume does not automatically negate a rally, but it does weaken conviction. The OBV is rising, which suggests the broader flow of money has still been supportive over time, yet the latest session did not show the kind of participation that typically accompanies a decisive breakout. In other words, the market likes KO, but it is not rushing in.
The combination of a squeeze, rising OBV, and muted turnover is the story here: the stock is coiling, but the coil has not yet snapped.
Key Levels & Scenarios
The immediate technical map is straightforward. A sustained move above 84.25 would put attention back on the 3-month high at 85.68, while failure to hold the lower end of the recent range around 79.39 would weaken the current uptrend and bring the SMA20 at 81.84 into focus as an early warning zone. Because the price is already at 100% of the 20-day range, the next move matters more than the last one: continuation would signal that buyers are willing to pay up even near resistance, while rejection would suggest the rally has run into a familiar ceiling.
Technical Verdict: HOLD (wait & see)
HOLD (wait & see) is supported by the price above the SMA20 and SMA50, the positive MACD setup, and the Bollinger squeeze that could precede a larger move. The reason not to upgrade the stance is the light volume, which leaves the current push short of strong confirmation, even though RSI and Stochastic remain constructive. The verdict is invalidated if price falls below 79.39, which would break the recent range support and weaken the uptrend structure. For non-traders, that means KO looks steady, but the market is still waiting for proof that this move has real force behind it.
Next on the tape: whether Coca-Cola can turn 84.25 from resistance into a base for a run at 85.68.
Summary Data KO
| Last price | 84.25 USD |
| Change 1 day / 5 days / 1 month | 0.91% / 1.55% / 2.08% |
| Trend / MA-cross | uptrend / none |
| SMA20 / SMA50 | 81.84 / 80.70 |
| RSI (14) / Stochastic %K | 60.6 / 75.6 |
| Bollinger %B / ATR | 88% / 1.75 |
| Support / Resistance 20 days | 79.39 / 84.25 |
| Data as of | 13 Juli 2026 20:30 WIB |
Track KO stock price daily: live levels, support/resistance and our full KO analysis history.