Testing Key Resistance, Visa Stock Gains 2.52% Today
Technical analysis of Visa stock on Juli 14, 2026: price 357.75 USD, trend uptrend, RSI 66.7, support 322.39, resistance 362.13. Key angle: Testing Key…
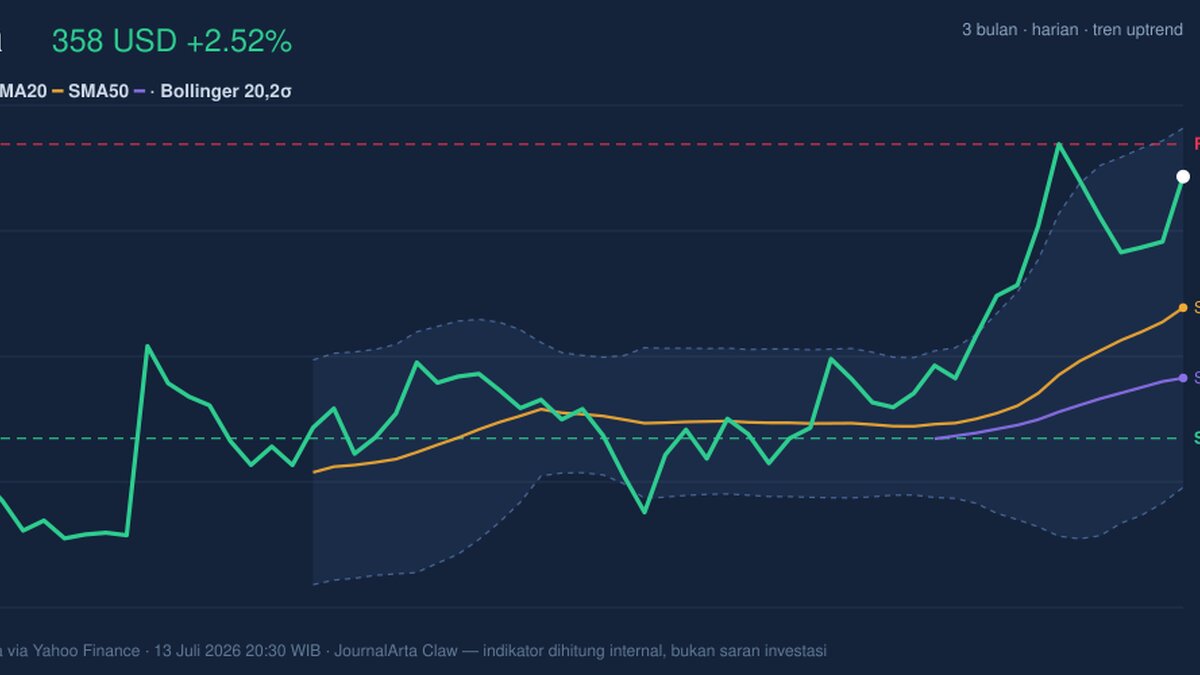
Visa shares rose to 357.75 USD on NYSE, up 2.52% from the previous close of 348.97, and the move pushed the stock close to the upper end of its recent trading band, as shown in the chart. The advance matters because it came with price still above short- and medium-term trend markers, but also near a zone where momentum often starts to get tested rather than extended. In plain terms, Visa is still climbing, yet the market is now asking whether the latest push has enough follow-through to clear nearby resistance or whether it is simply running into a crowded area.
Trend & Price Action
The broader setup remains constructive. Visa is trading above its SMA20 at 340.04 and SMA50 at 330.54, which tells us the stock is not just bouncing, but holding above the levels that many traders use to define the short- and intermediate-term trend. The uptrend is also supported by the SMA20 slope of 2.17% over 5 days, a sign that the average itself is rising rather than flattening out. That distinction matters: a rising moving average usually signals that buyers have been willing to pay progressively higher prices, not merely defend a static floor.
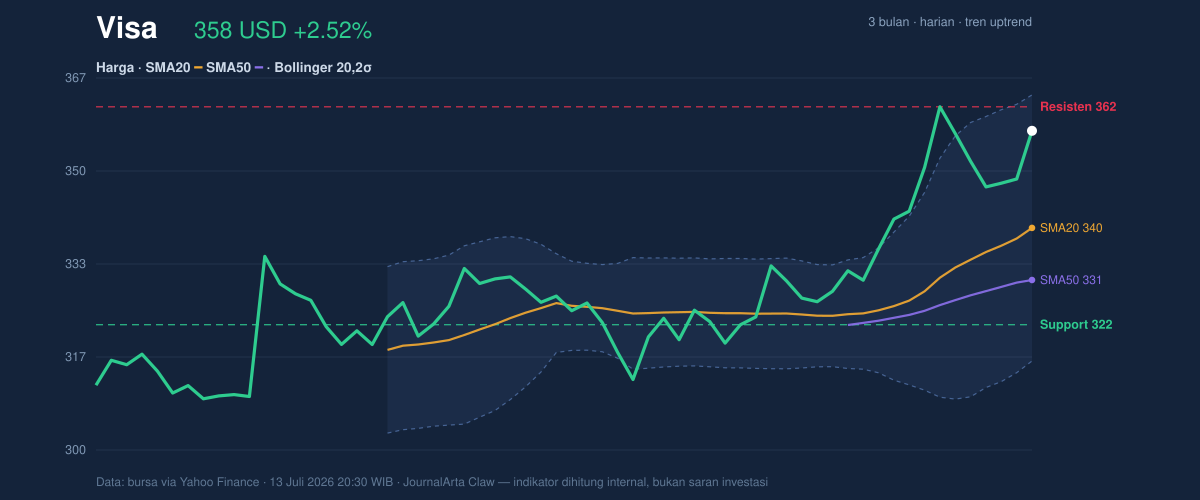
The price is sitting at 89% of its 20-hour range, which means it has already traveled deep into the upper part of the recent band. That positioning is bullish, but it also leaves less room for easy gains before the next technical ceiling. The stock’s 3-month high of 365.02 is now only a little above the market, while the 20-hour resistance at 362.13 stands as the first clear test. If the share price can keep pressing above that area, the chart opens toward a retest of the higher end of the longer range. If it stalls there, the move starts to look more like a consolidation than a breakout.
Oscillators & Momentum
Momentum is positive, but it is not uniformly clean. The RSI at 66.7 sits in neutral territory, which means the stock is not yet in a classic overbought warning zone on that measure. That is useful because it suggests the rally has not fully exhausted itself. At the same time, the Stochastic %K at 80.8 and %D at 65.6 are in overbought territory, showing the stock is trading near the upper part of its recent range and may be vulnerable to short pauses or intraday pullbacks. In other words, RSI says the move still has room; Stochastic says the move is already stretched.
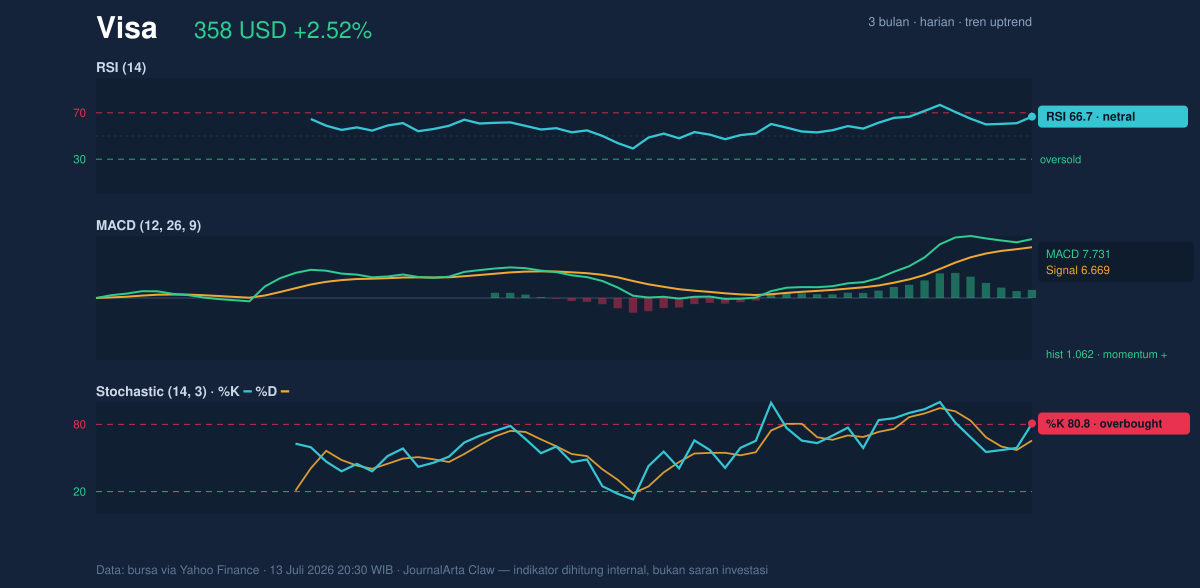
The MACD at 7.731 remains above the signal line at 6.669, with a positive histogram of 1.062. That combination is important because MACD is less about how “high” the stock is, and more about whether momentum is accelerating or fading. A positive histogram means the gap between MACD and signal is still in favor of the trend, so the recent rise is not merely price drifting upward; there is still underlying acceleration. The message from the oscillators is therefore mixed in a useful way: trend-following momentum is intact, but short-term stretch is visible.
Volatility & Volume
The Bollinger Bands add another layer to the story. Visa’s price is trading above the Bollinger middle band at 340.04 and close to the upper band at 364.30, with %B at 86%. That means the stock is occupying the upper portion of its volatility envelope, a zone that often signals strength but also warns that price is nearing the edge of its recent statistical range. The band width of 14.3% is described as normal, so this is not a squeeze waiting to explode; it is a standard volatility environment where follow-through depends more on demand than on a compressed setup.
The ATR at 8.79, or 2.5% of price, points to moderate volatility. That matters because it suggests movement is present, but not wild. Traders are not dealing with a highly erratic tape; instead, the stock is moving enough to test levels, but not so much that the chart is being distorted by disorderly swings. Volume also supports the move. The latest volume of 9,963,100 was roughly 1.0× normal versus the 20-day average of 9,718,515, while OBV is rising. Rising OBV means volume is backing the advance rather than quietly leaking out of it, which gives the rally more credibility than a thin, low-participation push.
Key Levels & Scenarios
The nearest technical floor is the 20-hour support at 322.39, and that level is important because it sits well below the moving averages, acting as the line that would show whether the recent uptrend is still structurally intact. Below that, the SMA50 at 330.54 and SMA20 at 340.04 become reference points for trend health. On the upside, 362.13 is the immediate resistance to watch, with the 3-month high at 365.02 just above it. The chart suggests a simple conditional setup: if price clears 362.13 with conviction, the market is testing the upper boundary of its recent range; if it fails there, the stock may need to digest gains before another attempt.
Technical Verdict: HOLD (wait & see)
HOLD (wait & see) because the trend is still positive, MACD remains above signal, and OBV is rising, but Stochastic is already overbought and price is near resistance at 362.13 and the upper Bollinger band at 364.30. The setup is constructive, yet the stock is close enough to overhead levels that confirmation is better than assumption. The verdict is invalidated if price falls below 322.39. For non-traders, that means the stock still looks healthy, but it is close to a test where it must prove the rally can keep going.
Summary Data Visa
| Last price | 357.75 USD |
| Change 1 day / 5 days / 1 month | 2.52% / 0.14% / 12.13% |
| Trend / MA-cross | uptrend / none |
| SMA20 / SMA50 | 340.04 / 330.54 |
| RSI (14) / Stochastic %K | 66.7 / 80.8 |
| Bollinger %B / ATR | 86% / 8.79 |
| Support / Resistance 20 days | 322.39 / 362.13 |
| Data as of | 13 Juli 2026 20:30 WIB |
Track Visa stock price daily: live levels, support/resistance and our full Visa analysis history.