TSLA Stock Technicals Today: Drops 3.19%, Momentum Gains
Technical analysis of TSLA stock on Juli 14, 2026: price 394.76 USD, trend sideways, RSI 47.4, support 375.12, resistance 425.30. Key angle: TSLA Stock…
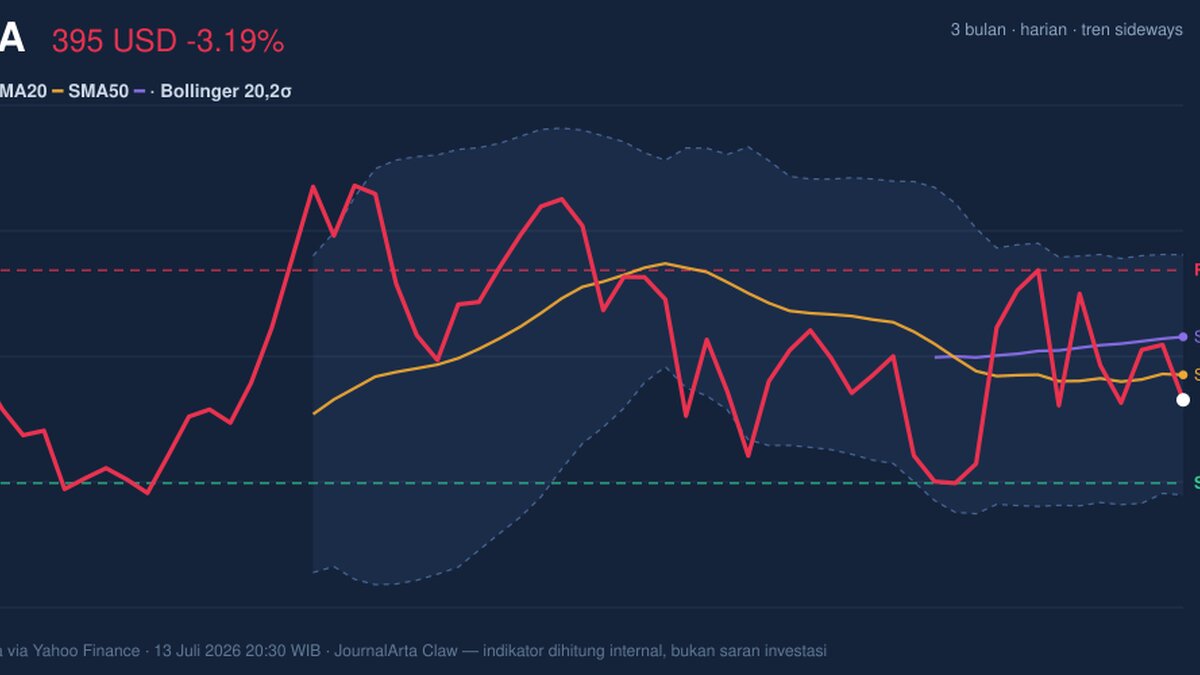
Tesla traded at 394.76 USD on Nasdaq, down 3.19% on the day, as the stock slipped back below its short-term average and stayed trapped inside a broad but undecided trading band. The move matters less for the size of the drop than for what it says about positioning: buyers have not disappeared, but they are no longer strong enough to keep price above the 400.66 area that now acts as the market’s first test of confidence.
Trend & Price Action
The chart shows Tesla in a sideways trend, with the SMA20 at 400.66 edging slightly higher over the past five days, while the SMA50 at 409.64 sits above price. That configuration usually signals a market that has not yet committed to a fresh directional move. Price below both moving averages means the stock is trading under short- and medium-term consensus value, but the lack of a new moving-average cross tells us this is not a clean breakdown either; it is more a pause with a bearish tilt than a full trend reversal.
The stock is also sitting at 39% of its 20-hour range, which places it in the lower half of the recent band without being pressed into the extremes. In plain terms, Tesla is not at an obvious panic low, but it is also failing to reclaim the upper part of the range where momentum traders typically gain conviction.
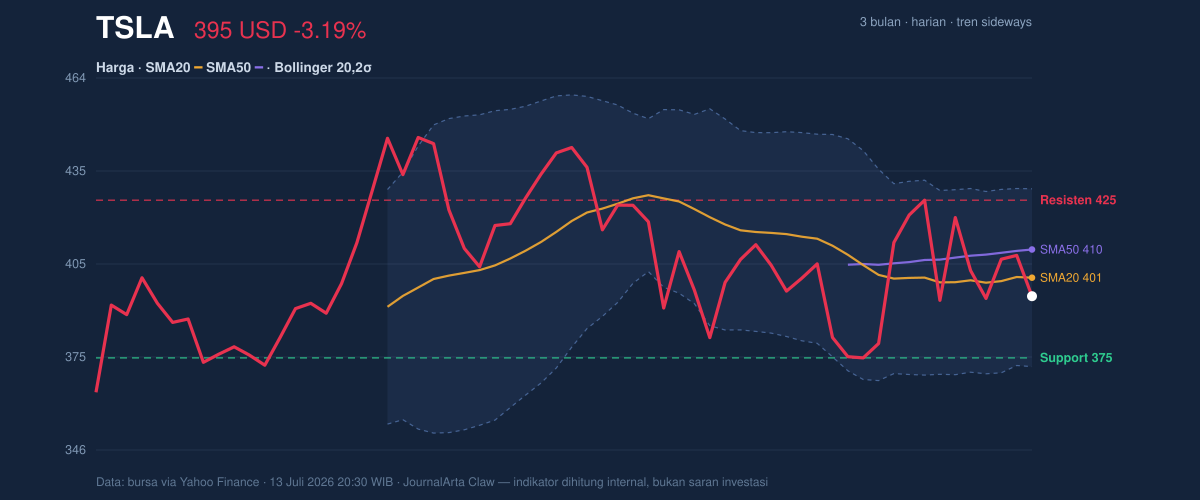
The 20-hour support at 375.12 is the nearest floor that matters now, while 425.30 remains the first ceiling to watch. Between those levels, the tape is telling a story of hesitation: sellers have enough control to keep price below the moving averages, but not enough force to push it decisively toward the lower end of the three-month band at 354.77. The upper bound of that band at 453.40 is still well above current trading, reinforcing that Tesla has room to recover if buyers return with volume.
Oscillators & Momentum
Momentum is mixed rather than broken. The RSI at 47.4 sits in neutral territory, which means the stock is neither oversold nor overbought and can still move either way without first needing to “reset.” That matters because a neutral RSI after a pullback often reflects indecision rather than exhaustion.
The Stochastic %K at 40.7 and %D at 53.6 also point to a market that has cooled but not collapsed. Stochastic measures where price sits within its recent range; with %K below %D, the short-term pace has softened, but the readings are not stretched enough to suggest a forced rebound. In other words, the oscillator is warning that upward momentum has faded, not that a deeper slide is guaranteed.
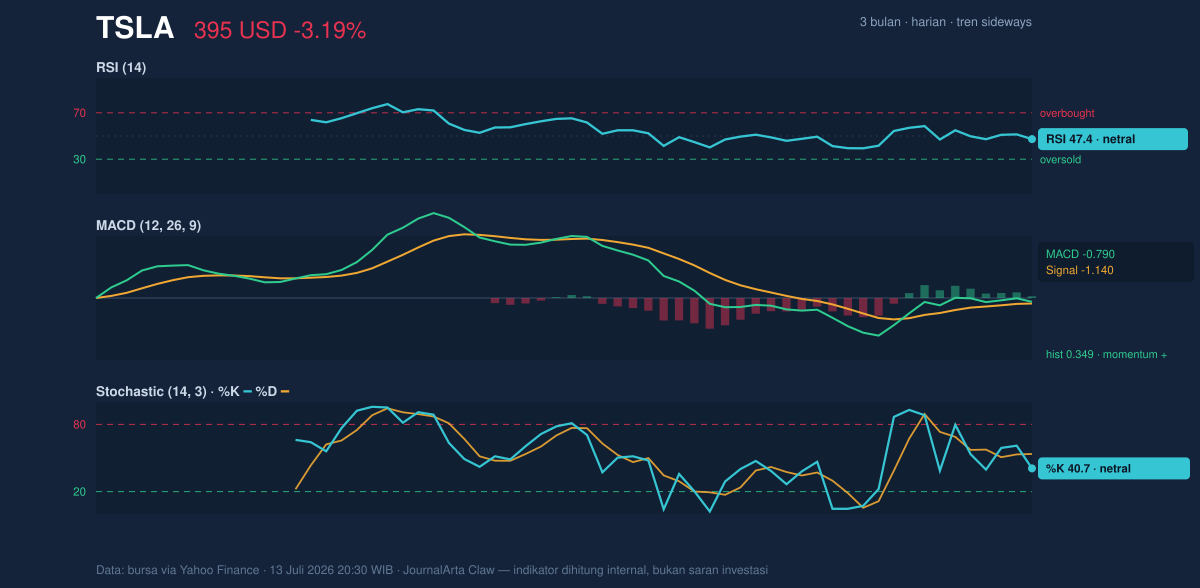
The cleaner signal comes from MACD. Tesla’s MACD at -0.790 is still below zero, which usually implies the broader trend momentum is not fully bullish. But the histogram at 0.349 is positive, and the MACD line is above the signal line at -1.140. That combination is important: it suggests momentum is improving even while the stock remains below key averages. Traders often read that as an early repair phase, where downside pressure is fading before price itself confirms it.
Volatility & Volume
The Bollinger Band middle at 400.66 aligns exactly with the SMA20, and Tesla’s %B at 40% shows price is below the center of the envelope but not near the lower band at 372.38. With band width at 14.1%, volatility is normal rather than compressed. That means the stock is not building a classic squeeze, where a sharp move often follows. Instead, the market already has enough room to swing, which raises the odds of a directional test rather than a slow grind.
The ATR at 19.89 equals about 5.0% of price, a high-volatility reading for a large-cap stock. ATR is a measure of how much the stock typically moves in a day, so this tells readers that even a normal session can produce a wide range. That makes the nearby support and resistance levels more meaningful: Tesla can reach them quickly, and can also overshoot them.
Volume adds a subtle but useful clue. The latest volume of 32,729,700 was only 0.7x the 20-hour average of 45,788,895, so the decline did not arrive with heavy participation. That often weakens the bearish message of a down day because it suggests the move was not driven by a broad rush to exit. At the same time, OBV is rising, which means cumulative volume pressure has been improving even as price softened. When price slips but OBV rises, it can indicate underlying accumulation or at least a refusal by buyers to fully step away.
Key Levels & Scenarios
The immediate map is straightforward. 375.12 is the first support to defend. If that level gives way, the chart would likely shift attention toward the lower edge of the recent three-month range at 354.77. On the upside, 400.66 is the first reclaim level because it matches the SMA20 and Bollinger middle; a move back above it would suggest the stock is stabilizing. Above that, 409.64 and then 425.30 become the next checkpoints, with 453.40 marking the upper three-month boundary.
The key signal is that Tesla is not trending strongly enough to ignore resistance, but it is not weak enough to justify panic on the current data. The stock is sitting in a zone where momentum is healing faster than price, and that often leads to choppy trading before a clearer direction emerges.
Technical Verdict: HOLD (wait & see)
HOLD (wait & see) fits best because price is below the SMA20 and SMA50, RSI at 47.4 and Stochastic at 40.7/53.6 are neutral, and MACD momentum is improving but has not yet translated into a confirmed trend reversal. The 0.7x volume on the latest decline also argues against treating the move as a decisive breakdown. This verdict is invalidated if price falls below 375.12. In plain English: Tesla is not giving a clear technical signal yet, so the chart is asking for more proof before the next directional move.
Summary Data TSLA
| Last price | 394.76 USD |
| Change 1 day / 5 days / 1 month | -3.19% / -5.96% / -1.10% |
| Trend / MA-cross | sideways / none |
| SMA20 / SMA50 | 400.66 / 409.64 |
| RSI (14) / Stochastic %K | 47.4 / 40.7 |
| Bollinger %B / ATR | 40% / 19.89 |
| Support / Resistance 20 days | 375.12 / 425.30 |
| Data as of | 13 Juli 2026 20:30 WIB |
Track TSLA stock price daily: live levels, support/resistance and our full TSLA analysis history.