NVDA Stock Drops 3.52%, Momentum Gains In Focus
Technical analysis of NVDA stock on Juli 14, 2026: price 203.53 USD, trend sideways, RSI 49.9, support 192.53, resistance 212.45. Key angle: NVDA Stock Drops.
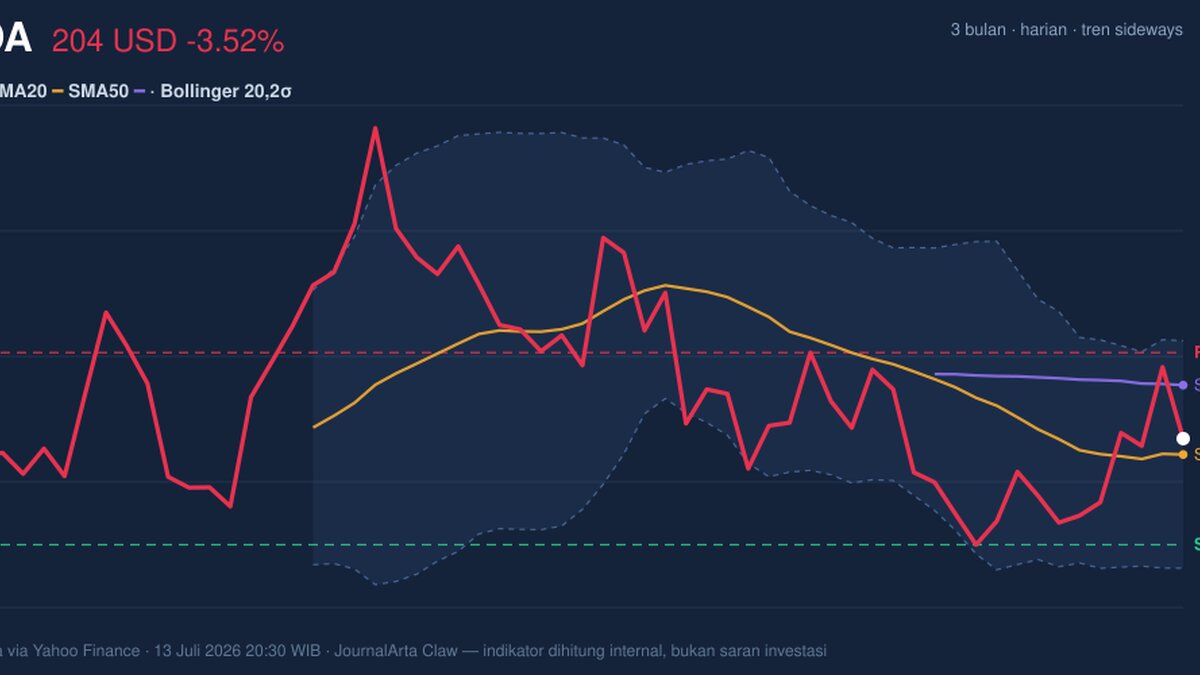
Nvidia fell on the Nasdaq, with NVDA last at 203.53 USD after a 3.52% daily drop, even though the shares still sit above the short-term trend line and inside a broader sideways range. The move matters because it shows a stock that is no longer pushing higher on momentum alone; instead, it is testing whether recent buyers can defend the area around the 20-day average while the market waits for the next catalyst.
Trend & Price Action
As shown in the chart, NVDA is trading above its SMA20 at 201.88 but below its SMA50 at 209.08, which is a classic sign of a stock caught between near-term support and a heavier medium-term ceiling. The absence of a fresh MA-cross tells traders there is no new trend signal from the moving averages yet; in plain language, the chart is not confirming a new breakout or a deeper breakdown, just a pause after a strong run.
The slope of the SMA20 at -0.22% over 5 days also points to a market that is drifting rather than accelerating. That is consistent with the broader sideways trend. The stock is not collapsing, but it is also not building the kind of upward structure usually seen when momentum is firmly in control. The 3-month range helps frame that picture: 236.54 is the recent high and 189.80 the low, so the current price is sitting in the middle of the band rather than near either extreme.
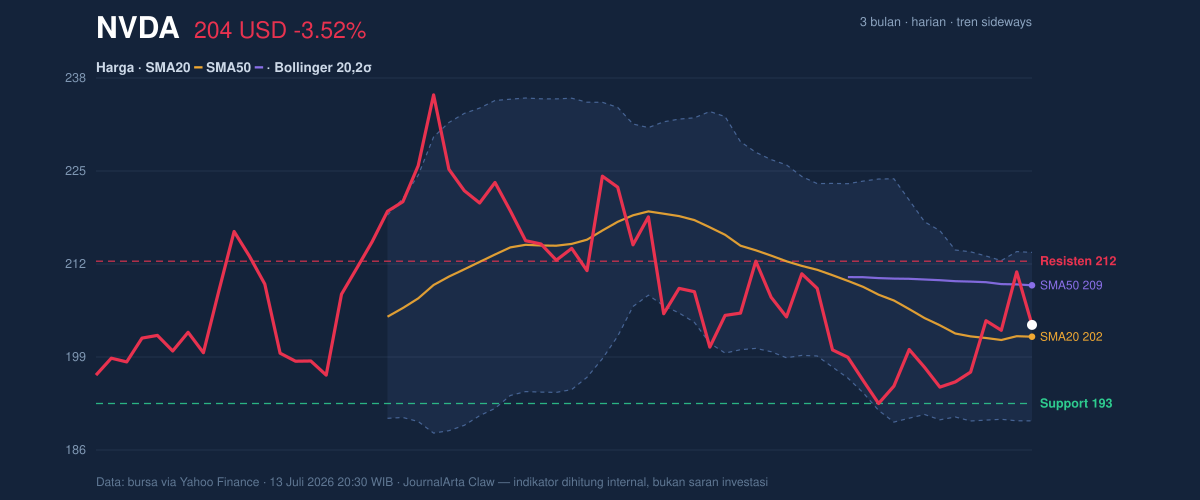
The current position at 55% of the 20-hour range suggests mild upward bias within the short-term channel, but not enough to call the move decisive. In practical terms, the stock is closer to resistance than support, yet still far enough from the upper boundary to avoid looking stretched.
Oscillators & Momentum
The momentum tools are mostly telling the same story: no strong trend, but no outright damage either. As shown in the chart, RSI at 49.9 is neutral, which means the stock is neither overbought nor oversold. That matters because it shows the pullback has not reached an emotional extreme where sellers are exhausted, but neither has it created the kind of overheating that often precedes a sharper correction.
The stochastic reading, with %K at 64.8 and %D at 68.6, is also neutral. Stochastic measures where the price sits within its recent range, so these levels indicate NVDA is still trading in the upper half of its short-term band, but not in a way that confirms a breakout. The lines are close, which usually means momentum is balanced rather than strongly directional.
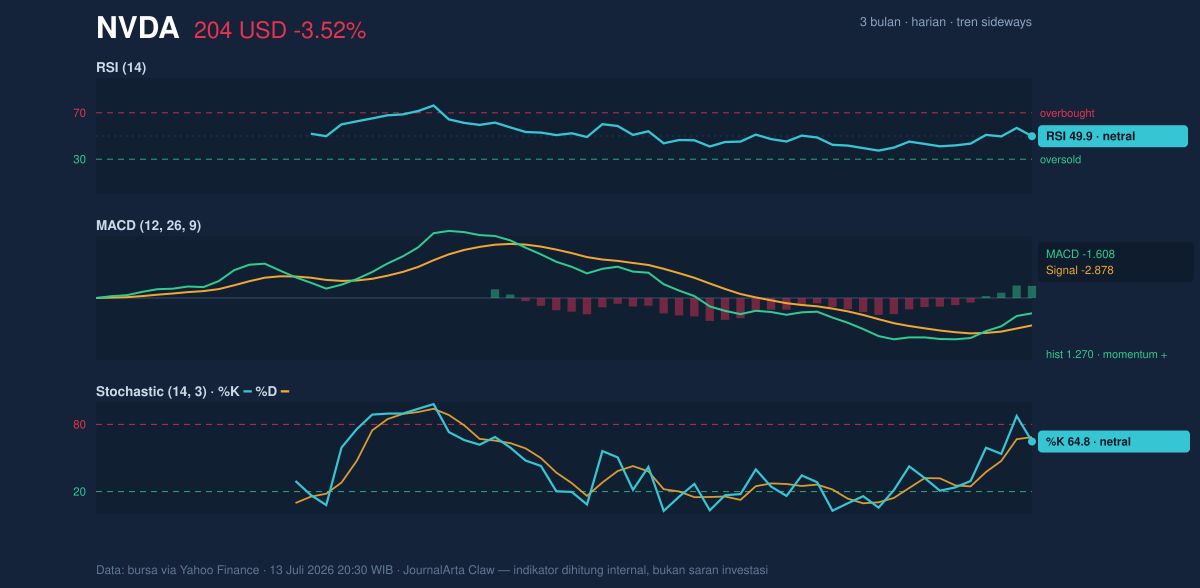
The more constructive signal comes from MACD. MACD at -1.608 remains below zero, which means the broader trend still lacks full upside confirmation, but the histogram at 1.270 is positive and the MACD line sits above the signal line at -2.878. That combination often means downside pressure is easing and short-term momentum is improving before the price fully reflects it. In other words, the chart is not yet bullish in a clean trend sense, but it is no longer behaving like a stock under heavy momentum stress.
Volatility & Volume
Bollinger Bands add useful context here. The price is above the middle band at 201.88 and below the upper band at 213.68, with %B at 57%. That means NVDA is trading slightly above the center of its recent volatility envelope, a position that usually signals balance rather than breakout conditions. The 11.7% band width is normal, so there is no squeeze suggesting an imminent volatility explosion, and no expansion implying a sudden trend move is already underway.
The ATR(14) at 6.92, or 3.4% of price, says daily swings remain moderate. For a stock like Nvidia, that is important: the market is still active, but not in a panic phase. The latest volume of 120,943,800 shares was below the 20-day average of 144,948,705, about 0.8x normal. Lower-than-average trading on a down day weakens the case for aggressive distribution, because it suggests the selloff was not backed by unusually heavy participation. That is reinforced by the fact that OBV is rising, a sign that cumulative volume flow is still leaning positive even as the price pauses.
Key Levels & Scenarios
The nearest short-term support is 192.53, with resistance at 212.45. Those levels matter more than the day-to-day noise because they define the current trading box. If NVDA can reclaim and hold above the resistance area, the chart would start to look less like a range and more like a renewed advance. If it fails to hold the support zone, the stock would be vulnerable to a deeper test toward the lower part of the 3-month range.
The key point is that price is still trading above the 20-day average, but the SMA50 at 209.08 and the nearby 212.45 resistance show that overhead supply remains real. That is why the chart reads as consolidation rather than trend acceleration.
Technical Verdict: HOLD (wait & see)
HOLD (wait & see) because the price is above SMA20 and OBV is rising, which keeps the short-term structure intact, while MACD histogram is positive, showing improving momentum beneath the surface. At the same time, RSI is neutral, stochastic is neutral, and the stock remains below SMA50 at 209.08, so there is no clean trend confirmation yet. The verdict is invalidated if price breaks below 192.53. For non-traders, that means the chart is balanced enough to avoid a bearish call, but not strong enough to claim a fresh uptrend.
The latest printed level on Nasdaq is 203.53 USD.
Summary Data NVDA
| Last price | 203.53 USD |
| Change 1 day / 5 days / 1 month | -3.52% / 4.08% / -0.65% |
| Trend / MA-cross | sideways / none |
| SMA20 / SMA50 | 201.88 / 209.08 |
| RSI (14) / Stochastic %K | 49.9 / 64.8 |
| Bollinger %B / ATR | 57% / 6.92 |
| Support / Resistance 20 days | 192.53 / 212.45 |
| Data as of | 13 Juli 2026 20:30 WIB |
Track NVDA stock price daily: live levels, support/resistance and our full NVDA analysis history.