MSFT Stock Gains 1.53%, Momentum Gains In Focus
Technical analysis of MSFT stock on Juli 14, 2026: price 390.99 USD, trend sideways, RSI 51.2, support 352.83, resistance 399.76. Key angle: MSFT Stock Gains.
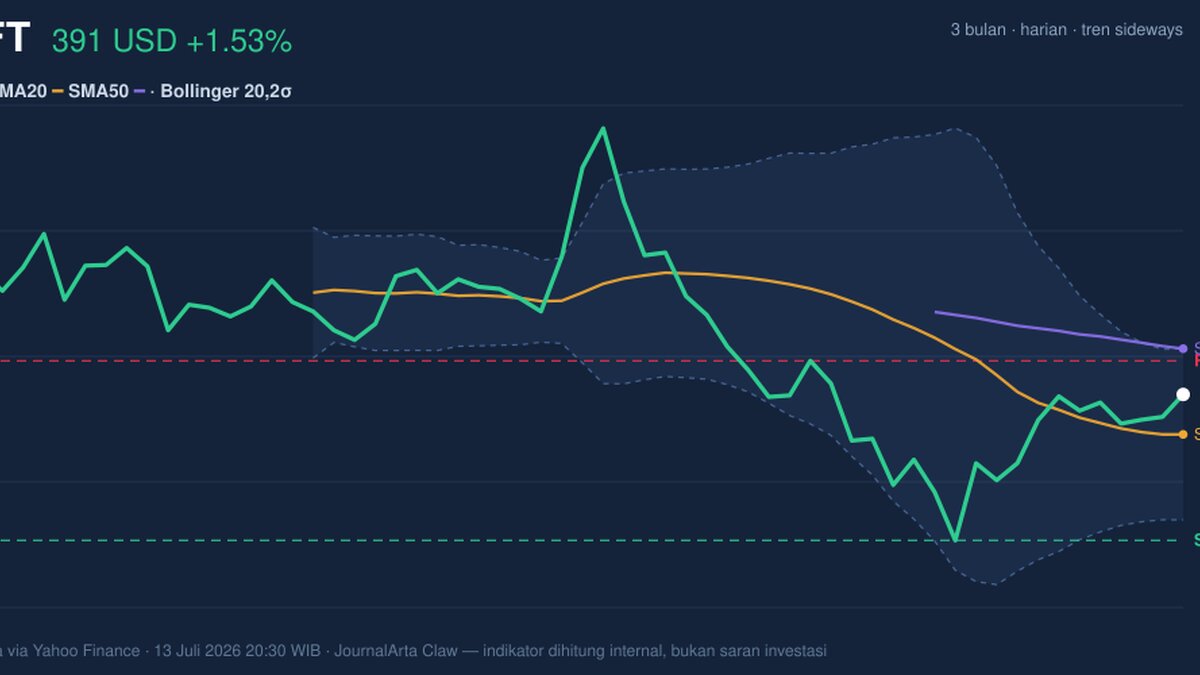
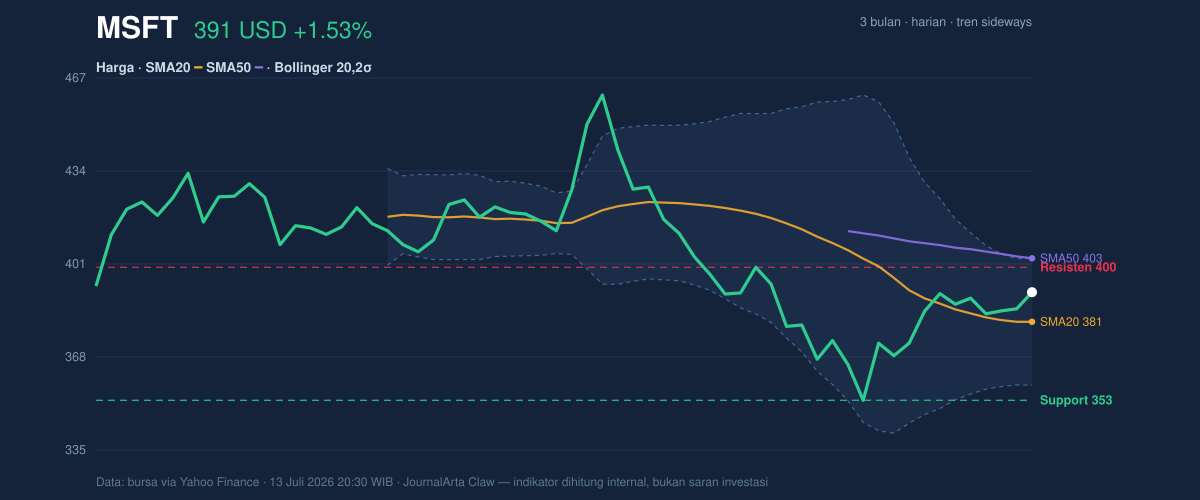
Microsoft shares rose in New York on Monday, with MSFT last trading at 390.99 USD, up 1.53% from the previous close, as the stock pushed higher inside a broad sideways pattern on the NASDAQ. The move matters because it came with the price reclaiming ground above its short-term average, but not yet clearing the heavier ceiling around the longer-term trend line. In plain terms, the chart is improving, but it is not cleanly resolved.
Trend & Price Action
The stock is still trading in a sideways trend, and that label is important: it means Microsoft is not in a decisive uptrend or downtrend, but rather moving in a range where traders are watching for a break in either direction. The price is above the SMA20 at 380.55, which usually signals that short-term buyers have regained some control after recent weakness. At the same time, MSFT remains below the SMA50 at 402.95, which tells investors the medium-term trend has not fully turned positive yet.
That split between the two averages is the core message on trend. The short-term picture is firmer than it was, but the longer-term structure still acts like a lid. The data also show no fresh MA-cross, meaning there has been no new moving-average crossover to confirm a stronger trend shift. As shown in the chart, price is sitting near the upper half of its recent band, with 390.99 USD close to the top of the 20-hour range at 399.76 and well above the 20-hour support at 352.83. It is also trading near the upper end of the 3-month range between 349.20 and 466.32, which suggests the stock has recovered from the lower part of that window, but still has room before it reaches the prior peak zone.
Oscillators & Momentum
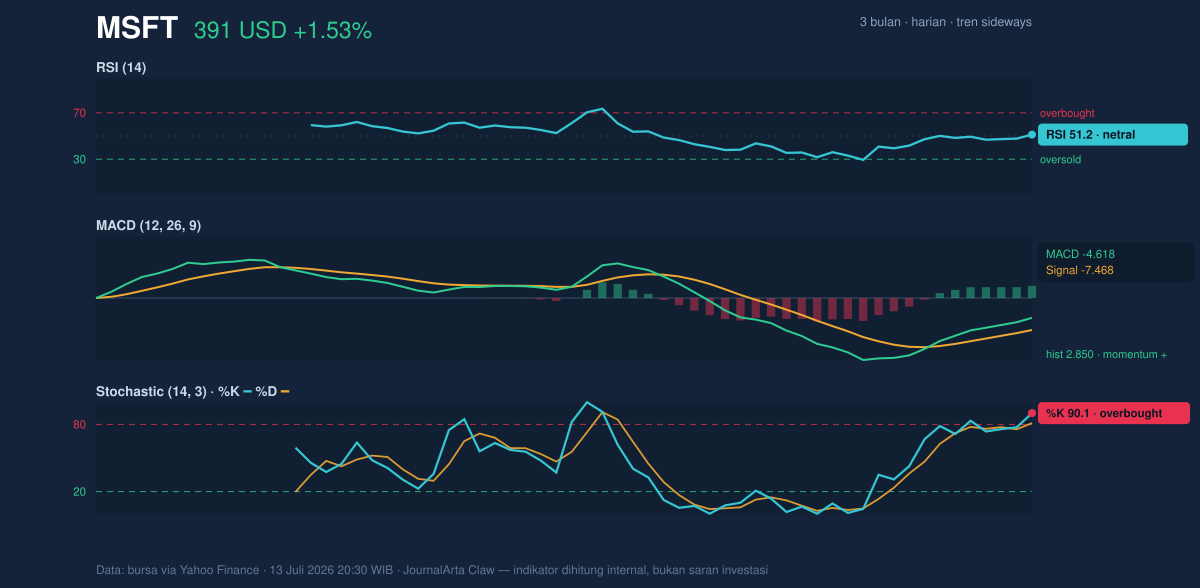
The momentum picture is mixed, and that is where the story becomes more nuanced. The RSI at 51.2 is neutral, which means the stock is neither stretched nor washed out on that measure. That is a sign of balance rather than conviction. By contrast, the Stochastic %K at 90.1 and %D at 81.1 are in overbought territory, indicating the latest push has moved quickly and may be vulnerable to a pause if buyers lose speed. In simple language, Stochastic is saying the stock has risen fast enough that it may need to cool off.
The MACD at -4.618 remains below zero, but the signal line at -7.468 is lower still, leaving a positive histogram of 2.850. That combination usually means downside momentum is fading and the short-term trend is strengthening from a low base, even if it has not fully crossed into a clearly bullish regime. So the oscillator set is not perfectly aligned: RSI is neutral, Stochastic is hot, and MACD is improving. As shown in the chart, that mix often appears during a rebound that is still being tested.
Volatility & Volume
Volatility is not extreme. The ATR(14) at 12.32, or 3.2% of price, points to moderate volatility, meaning the stock can still move meaningfully, but the day-to-day swings are not unusually wide. The Bollinger Bands are also telling a useful story: the middle band at 380.55 lines up with the SMA20, the upper band at 402.89 sits just above current price, and the lower band at 358.20 marks the downside cushion. With %B at 73%, MSFT is trading in the upper part of its recent volatility envelope, but not pressing the extreme top. The 11.7% band width is described as normal, which suggests the market is not preparing for an obvious volatility breakout yet.
Volume, however, is softer than ideal. The latest trading volume of 28,862,100 compares with a 20-hour average of 47,172,035, or about 0.6x normal. That means the advance is happening without strong participation, which weakens the message of the price move. A rally on light volume can still work, but it usually needs follow-through to prove that institutions are behind it. The one constructive counterpoint is that OBV is rising, suggesting that, over time, the balance of volume has been leaning in the right direction even if the latest session was not especially heavy.
Key Levels & Scenarios
The immediate battleground is clear. Resistance at 399.76 is the first obvious test, and it sits just beneath the SMA50 at 402.95 and the upper Bollinger band at 402.89. That cluster matters because it is where short-term momentum, the medium-term average, and the volatility ceiling converge. If the stock can move through that zone, it would suggest the rebound is no longer just a bounce inside a range.
On the downside, support at 352.83 is the key floor from the 20-hour range, while the lower Bollinger band at 358.20 offers a nearer volatility guide. A failure back below those levels would imply the recent strength has faded and that the sideways pattern is resolving lower again. The stock is currently at 81% of its 20-hour range, so it has already recovered a good portion of the recent move; that positioning can be constructive, but it also leaves less room for error if momentum stalls.
Technical Verdict: HOLD (wait & see)
HOLD (wait & see)
The case for this verdict rests on three signals: price is above the SMA20, which supports the short-term recovery; MACD histogram is positive, showing momentum is improving from a weak base; and OBV is rising, which suggests underlying accumulation is still present. Against that, price remains below the SMA50, Stochastic is overbought, and volume is only 0.6x normal, so the move has not yet earned full confirmation.
This verdict is invalidated if price breaks below 352.83. For non-traders, that means the stock looks better than it did, but it still needs proof before the chart can be called decisively stronger.
“We’re not seeing a clean breakout yet,” one market participant said, “just a stock trying to prove the rebound has real legs.”
Summary Data MSFT
| Last price | 390.99 USD |
| Change 1 day / 5 days / 1 month | 1.53% / 1.10% / 0.17% |
| Trend / MA-cross | sideways / none |
| SMA20 / SMA50 | 380.55 / 402.95 |
| RSI (14) / Stochastic %K | 51.2 / 90.1 |
| Bollinger %B / ATR | 73% / 12.32 |
| Support / Resistance 20 days | 352.83 / 399.76 |
| Data as of | 13 Juli 2026 20:30 WIB |
Track MSFT stock price daily: live levels, support/resistance and our full MSFT analysis history.