BP Stock Gains 7.01%, Testing Key Resistance In Focus
Technical analysis of BP stock on Juli 15, 2026: price 516.50 GBp, trend sideways, RSI 54.2, support 455.60, resistance 513.40. Key angle: BP Stock Gains.

BP plc shares have staged a sharp recovery on the London Stock Exchange, surging 7.01% to a last price of 516.50 GBp as trading volume underscored a sudden, aggressive shift in market appetite. This move is more than a mere flicker of volatility; it represents a significant structural break from recent lethargy, effectively pushing the stock through its 20-day resistance levels.
Price Action and Structural Shift
The technical landscape for BP has shifted decisively. After weeks of consolidation, the stock’s ascent above the SMA20 (483.56 GBp) confirms that the immediate downward bias has been neutralized. While the price remains slightly below the SMA50 (519.62 GBp), the current posture is a classic attempt to pivot from a sideways trend toward a renewed upward phase.
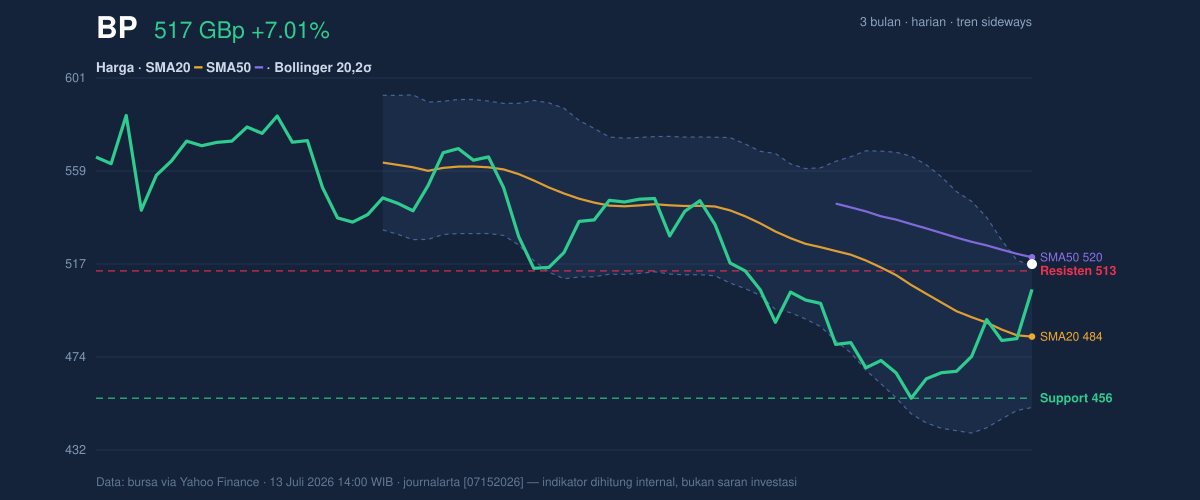
Notably, the price has pushed beyond the upper band of the Bollinger envelope (515.74 GBp), with a %B indicator of 101%. In technical terms, a %B exceeding 1.0 suggests the price is trading outside its recent statistical norms, which often signals an initial breakout or, alternatively, an unsustainable stretch that may invite profit-taking. With the ATR(14) at 12.03, the stock is displaying moderate volatility, meaning the current breakout is backed by a healthy range rather than erratic, noise-driven spikes.
Momentum and Participation
The engine behind this move is evident in the volume data. Trading activity surged to 64.29 million shares, significantly outpacing the 20-day average of 40.34 million. This 1.6x jump in volume confirms that institutional conviction is driving the breakout, rather than low-liquidity retail sentiment.
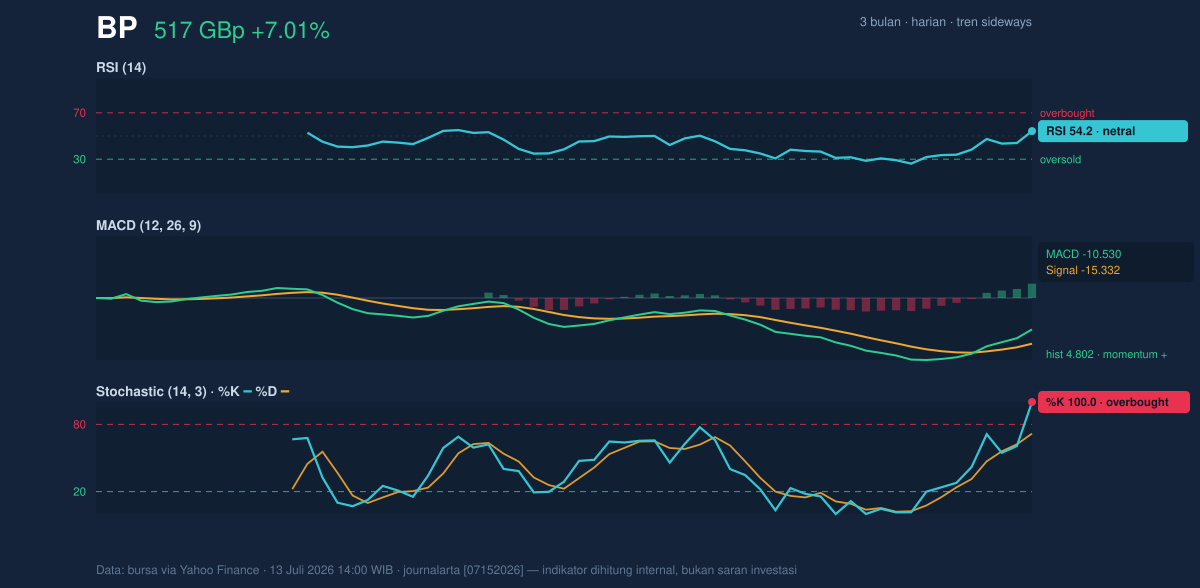
The momentum indicators provide a more nuanced picture. The MACD is showing positive momentum with a value of -10.530 hovering above the signal line (-15.332). The positive histogram suggests that the underlying trend is gaining speed. However, caution is warranted by the Stochastic oscillator at 100.0 (%K), which is deep into overbought territory. While this confirms the strength of the current rally, it also suggests that the market is temporarily stretched, leaving the stock vulnerable to a cooling-off period if the current momentum fails to transition into sustained buying pressure above the 519.62 GBp resistance level.
Key Levels & Scenarios
The stock is currently testing critical thresholds. The 20-day resistance of 513.40 GBp has been reclaimed, turning it into immediate short-term support. If the stock fails to hold the current breakout and retreats below this level, it risks a "mean reversion" back toward the SMA20. Conversely, should the price clear the SMA50 (519.62 GBp) with similar volume, the next structural hurdle is the 3-month high of 592.00 GBp. The OBV (On-Balance Volume) is rising, a signal that accumulation is currently outpacing distribution, providing a tailwind for the bulls.
Technical Verdict: HOLD (wait & see)
The verdict is a HOLD based on the following:
* The stock is currently overbought per Stochastic (100.0), suggesting that the recent 10.41% five-day gain may be due for a brief consolidation.
* While the MACD momentum is positive, the price is currently bumping against the SMA50 (519.62 GBp), which acts as a secondary layer of overhead resistance.
* Verdict invalidated if price breaks above 520.00 GBp, which would signal a breakout from the SMA50 and a shift to a more bullish conviction.
Parameters for monitoring:
* Entry Range: 485.00 – 495.00 GBp (seeking a retest of the broken resistance).
* Exit Target (Resistance): 592.00 GBp.
* Stop Loss: 455.60 GBp (20-day support).
*Disclaimer: This analysis is for educational purposes and does not constitute financial advice. The recent price action indicates a stock that is currently overextended in the short term, suggesting that traders may prefer to wait for a consolidation before assessing the strength of the move toward the 50-day moving average.*
*The next pivotal movement will likely be determined by the stock's ability to sustain its position above the 515.74 GBp Bollinger band during the next full trading session.*
Summary Data BP
| Last price | 516.50 GBp |
| Change 1 day / 5 days / 1 month | 7.01% / 10.41% / -0.10% |
| Trend / MA-cross | sideways / none |
| SMA20 / SMA50 | 483.56 / 519.62 |
| RSI (14) / Stochastic %K | 54.2 / 100.0 |
| Bollinger %B / ATR | 101% / 12.03 |
| Support / Resistance 20 days | 455.60 / 513.40 |
| Data as of | 13 Juli 2026 14:00 WIB |


