HSBC Stock Technicals Today: Drops 0.59%, Testing Key Resistance
Technical analysis of HSBC stock on Juli 15, 2026: price 152.60 HKD, trend uptrend, RSI 66.8, support 142.80, resistance 153.80. Key angle: HSBC Stock…

HSBC Holdings (0005.HK) navigated a marginal retreat in the latest session, closing at 152.60 HKD, a 0.59% dip that follows a robust monthly appreciation of 10.18%. While the broader market reflects a cooling period, the bank’s structural foundation remains anchored by a firm bullish alignment, with the share price sustaining its position above both the SMA20 at 149.31 HKD and the SMA50 at 144.84 HKD. This positioning suggests that despite the daily volatility, the primary trend remains decisively upward.
Trend and Price Structure
The current price action reveals a stock testing the upper boundaries of its established range. With the price sitting at 89% of the 20-day support/resistance spread, HSBC is currently trading near the 153.80 HKD resistance level. The SMA20 slope of 2.22% over the last five days confirms that the medium-term momentum is healthy, yet the proximity to the 154.60 HKD three-month high introduces a psychological ceiling that traders are currently monitoring with caution.
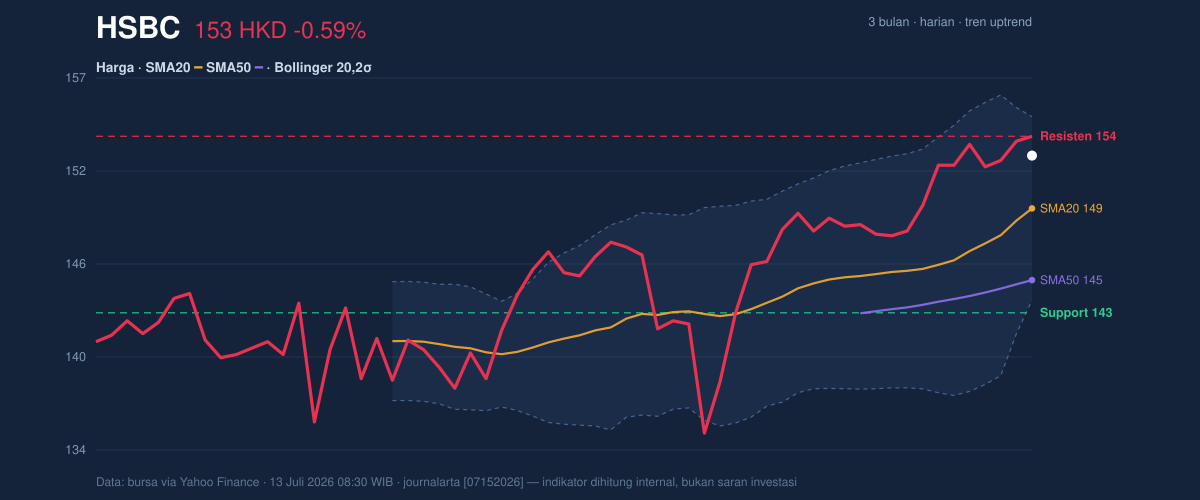
The Bollinger Bands further illustrate this tightening pressure. With a %B of 79% and a band width of 7.7%, the stock is experiencing a Bollinger squeeze. This indicator traditionally signals that the market is coiling, often preceding a significant expansion in volatility. Whether this break occurs to the upside of the 155.03 HKD upper band or undergoes a mean reversion toward the 149.31 HKD midline remains the core pivot for short-term sentiment.
Momentum and Liquidity
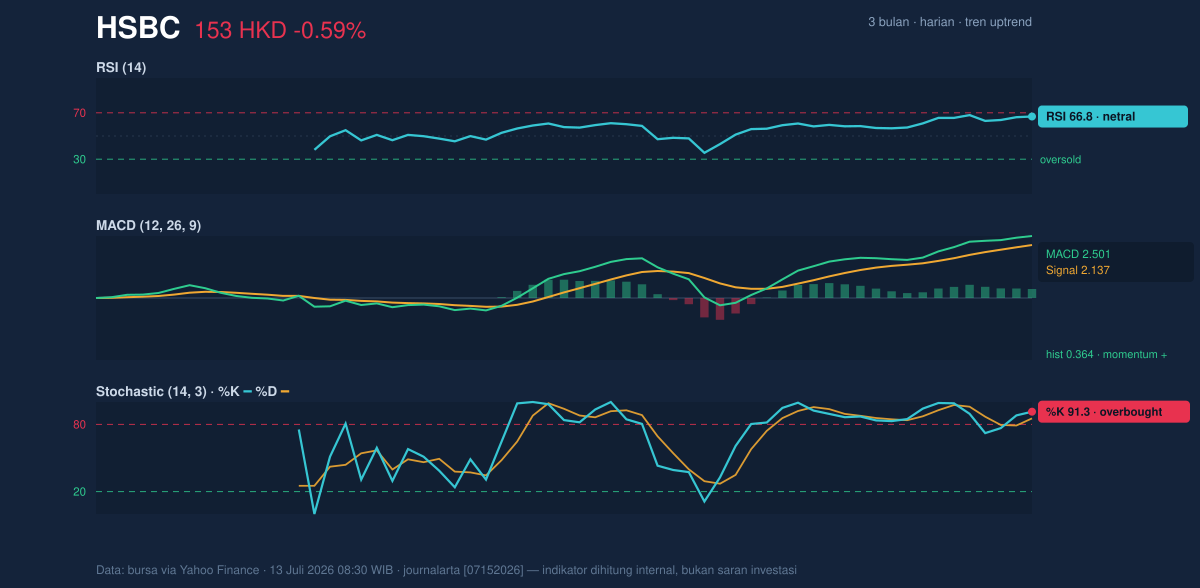
Momentum indicators offer a more nuanced warning. While the MACD is positive at 2.501 with a growing histogram of 0.364, suggesting sustained strength, the Stochastic oscillator presents an overbought status at 91.3/85.3. This divergence between the MACD’s confirmation and the Stochastic’s stretched levels indicates that the recent rally may be exhausting its immediate upward velocity.
Compounding the exhaustion signal is the volume profile. Trading activity has thinned to 7,632,722 shares, which is roughly 0.5x the 20-day average. In technical terms, an uptrend on low volume often lacks the conviction of institutional buyers, placing the burden of proof on the next breakout attempt. Nevertheless, the rising On-Balance Volume (OBV) suggests that despite the thin trading, distribution remains minimal and long-term holders are not offloading positions.
Key Levels & Scenarios
The immediate battlefield is defined by the 153.80 HKD resistance level. A definitive close above this mark, supported by a return of trading volume, would validate the bullish trajectory toward the recent 154.60 HKD high. Conversely, should the price fail to hold the 149.31 HKD midline—which now serves as primary psychological support—the ATR of 2.46 suggests a potential drift toward the 143.59 HKD lower Bollinger Band.
Technical Verdict: HOLD (wait & see)
- Stochastic overbought condition suggests a high probability of a short-term cooling-off period.
- Low trading volume (0.5x average) indicates insufficient momentum to clear the current resistance zone with conviction.
- Verdict invalidated if price sustains a close above 154.60 HKD, suggesting a breakout of the current consolidation.
Technical Plan:
- Ideal Entry Range: 145.00 HKD – 148.00 HKD (retest of moving averages).
- Exit Target (Resistance): 153.80 HKD – 155.00 HKD.
- Stop Loss: 142.80 HKD (20-day support).
The lack of volume near the recent highs suggests investors are waiting for a clearer catalyst before committing to the next leg of the move.
Summary Data HSBC
| Last price | 152.60 HKD |
| Change 1 day / 5 days / 1 month | -0.59% / 0.39% / 10.18% |
| Trend / MA-cross | uptrend / none |
| SMA20 / SMA50 | 149.31 / 144.84 |
| RSI (14) / Stochastic %K | 66.8 / 91.3 |
| Bollinger %B / ATR | 79% / 2.46 |
| Support / Resistance 20 days | 142.80 / 153.80 |
| Data as of | 13 Juli 2026 08:30 WIB |



