MELI Stock Technicals Today: Gains 1.17%, Golden Cross Formed
Technical analysis of MELI stock on Juli 15, 2026: price 1,873.88 USD, trend uptrend, RSI 69.7, support 1,583.66, resistance 1,867.30. Key angle: MELI Stock…

MercadoLibre (MELI) has maneuvered into a position of distinct technical strength, currently trading at 1,873.88 USD as of July 13, 2026. This move reflects a 1.17% gain over the last session, contributing to a broader 16.39% climb over the past month. For the Latin American e-commerce giant, the current market structure suggests that aggressive participants are betting on sustained momentum, pushing the stock price well above both its short-term and medium-term moving averages.
Trend and Price Structure
The primary engine of the current rally is a confirmed Golden Cross, where the SMA20 (1,707.31) has decisively crossed above the SMA50 (1,685.23). This is a classic long-term signal that the underlying trend has shifted toward a bullish orientation. The price is currently comfortably above both averages, with the SMA20 slope rising by 3.30% over the last five days, indicating that the speed of the ascent is accelerating.
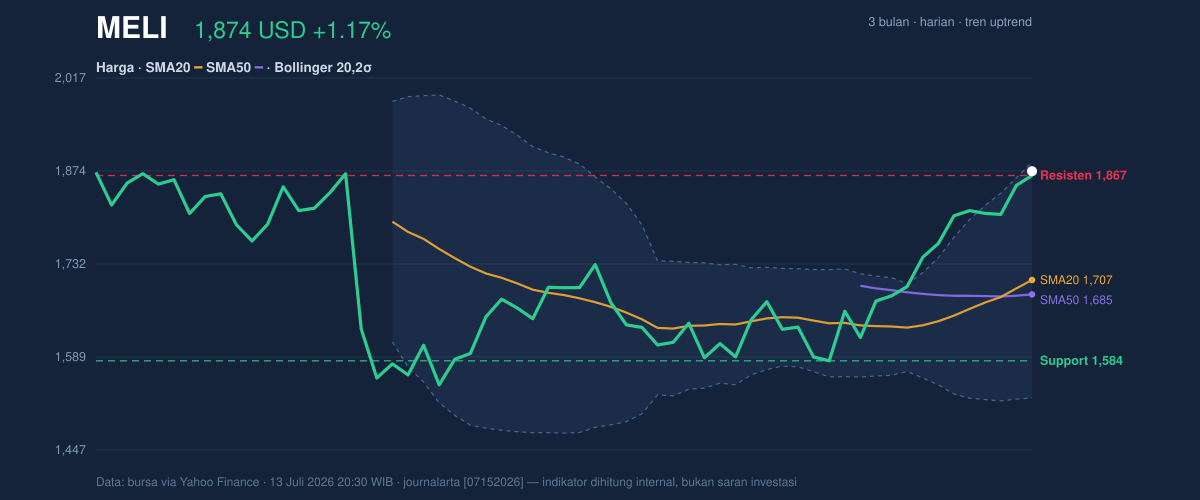
However, the rapid nature of this ascent is pushing against the upper boundaries of technical norms. With the stock price currently situated at 102% of the recent 20-day trading range and nearing its 3-month high of 1,903.00 USD, the market is entering a "stretch" phase where buyers are paying a premium relative to recent historical averages.
Oscillators and Momentum
While the trend is undeniably higher, momentum indicators urge caution regarding the sustainability of this immediate pace. The Stochastic indicator at 91.0/90.2 sits firmly in overbought territory, signaling that the swift price appreciation over the last month may have exhausted the immediate supply of buyers. Despite this, the RSI at 69.7 remains technically netral, showing the stock is hovering just below the 70 threshold that typically signals a market is "too hot."
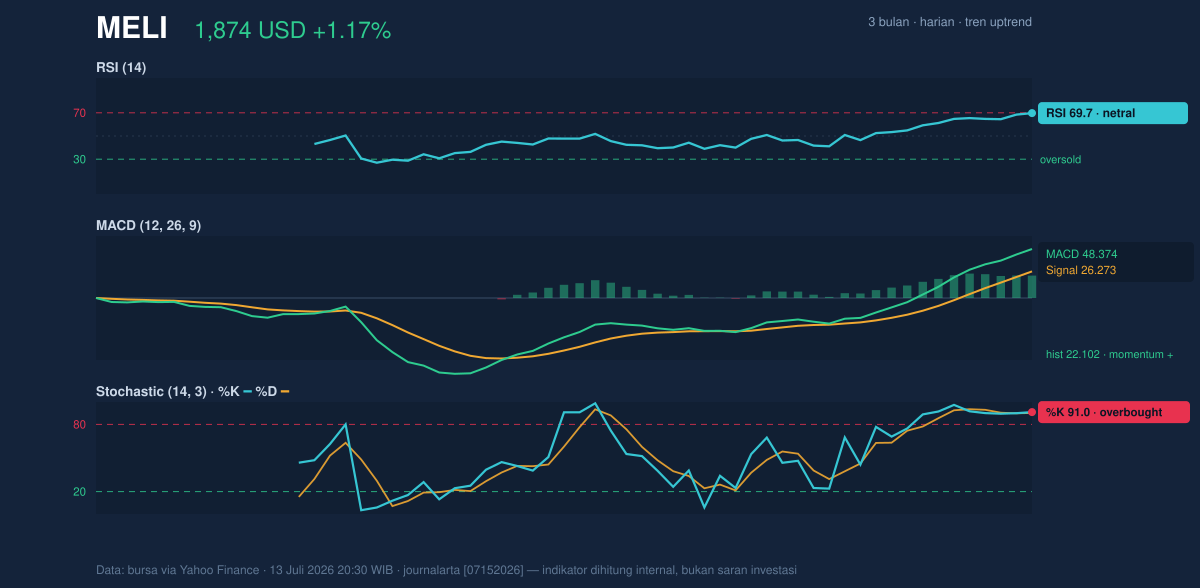
Supporting this is the MACD (48.374), which remains in positive territory above the signal line. The histogram value of 22.102 confirms that the bullish momentum is still active and providing the "fuel" to keep the stock elevated despite the overbought condition of the Stochastic oscillator.
Volatility and Volume
Market participation is increasing alongside price. Trading volume reached 483,900 shares, roughly 1.1x the 20-day average, confirming that the breakout is being supported by actual institutional flow rather than thin-market movement. Furthermore, the OBV (On-Balance Volume) is rising, a reliable signal that the "smart money" is accumulating the stock rather than distributing it at these higher levels.
The Bollinger Bands (%B at 96%) reveal a significant expansion in the width of the band (21.1%), which highlights that volatility is currently elevated. When prices hug the upper Bollinger band, it suggests high intensity; however, it also leaves the stock vulnerable to a reversion toward the band's median, the SMA20 (1,707.31), should profit-taking trigger a consolidation phase.
Key Levels and Scenarios
The immediate focus for market participants is the resistance at 1,867.30 USD, which the price has effectively tested and slightly surpassed. If the price sustains a clean break and consolidation above this level, the path opens toward the 3-month high of 1,903.00 USD. Conversely, if the stock fails to hold the current breakout and retreats, the support at 1,583.66 USD acts as the primary safety net.
Technical Verdict: HOLD (wait & see)
* Reasons: 1) The Stochastic is overbought (91.0), suggesting an imminent consolidation phase. 2) The Bollinger %B (96%) indicates the price is hitting the top of its statistical range, making entry at current levels carry an unfavorable risk-to-reward ratio. 3) The verdict is invalidated if the price successfully consolidates above 1,887.84 USD for more than three consecutive sessions.
* Entry Range: 1,707.31 – 1,750.00 USD (post-pullback).
* Exit Target (Target Price): 1,903.00 USD.
* Stop Loss Protection: 1,583.66 USD.
The stock is currently exhibiting strong bullish trends, but its overextended position suggests that new capital should wait for a temporary price cooling before seeking a re-entry.
The company last reported that volume of shares traded reached 483,900, significantly exceeding the 20-day average of 449,805.
Summary Data MELI
| Last price | 1,873.88 USD |
| Change 1 day / 5 days / 1 month | 1.17% / 3.78% / 16.39% |
| Trend / MA-cross | uptrend / golden |
| SMA20 / SMA50 | 1,707.31 / 1,685.23 |
| RSI (14) / Stochastic %K | 69.7 / 91.0 |
| Bollinger %B / ATR | 96% / 59.43 |
| Support / Resistance 20 days | 1,583.66 / 1,867.30 |
| Data as of | 13 Juli 2026 20:30 WIB |


