Momentum Gains, CVX Stock Gains 3.04% Today
Technical analysis of CVX stock on Juli 15, 2026: price 181.76 USD, trend sideways, RSI 57.8, support 165.69, resistance 187.22. Key angle: Momentum Gains.

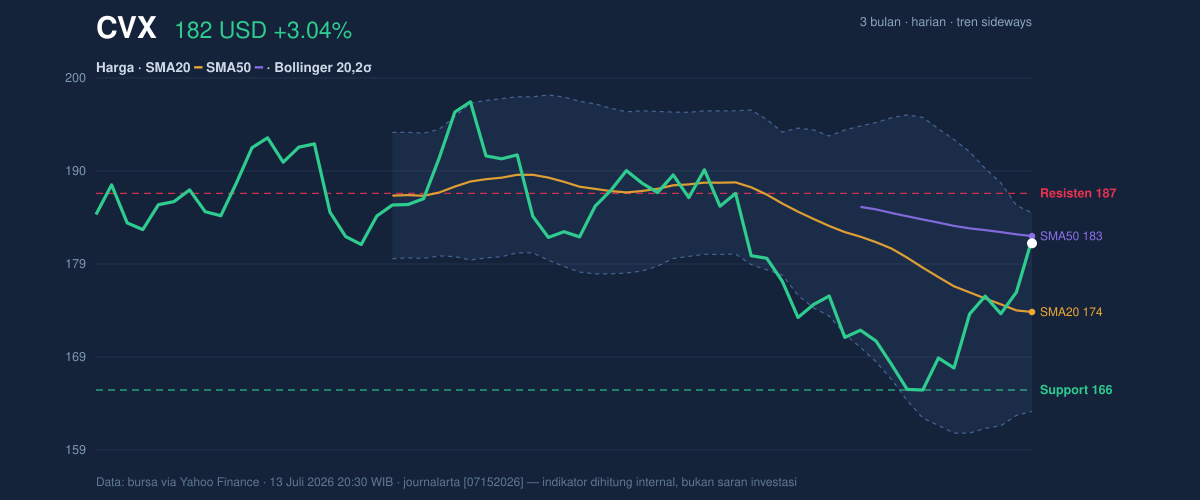
Chevron Corporation (CVX) shares closed the July 13 session at 181.76 USD, marking a sharp 3.04% single-day gain that reflects a broader attempt to stabilize after a period of indecision. Despite a cooling 2.18% drop over the trailing month, the recent 8.13% rally over the last five days suggests institutional interest is returning to the energy major as it tests significant technical overhead.
Trend and Price Structure
The stock is currently navigating a complex landscape between its moving averages. While the price of 181.76 USD sits comfortably above the SMA20 of 174.23 USD, it remains constrained below the SMA50 of 182.55 USD. This structural positioning indicates a transition phase; the negative slope of the SMA20 (-1.59% over 5 days) highlights that the medium-term trend is still recovering from recent weakness. Investors are observing whether the current surge can push the stock through the SMA50, which would signal a shift toward renewed bullish dominance.
Momentum and Oscillators
Market participation is sending mixed signals. The RSI of 57.8 remains in neutral territory, suggesting that while the immediate momentum is positive, there is plenty of room for further upside before reaching overextended levels. However, the Stochastic %K at 99.0 and %D at 83.5 places the stock firmly in overbought territory. This divergence suggests that while the trend is strengthening, the speed of the recent climb may necessitate a brief pause or minor retracement to consolidate gains.
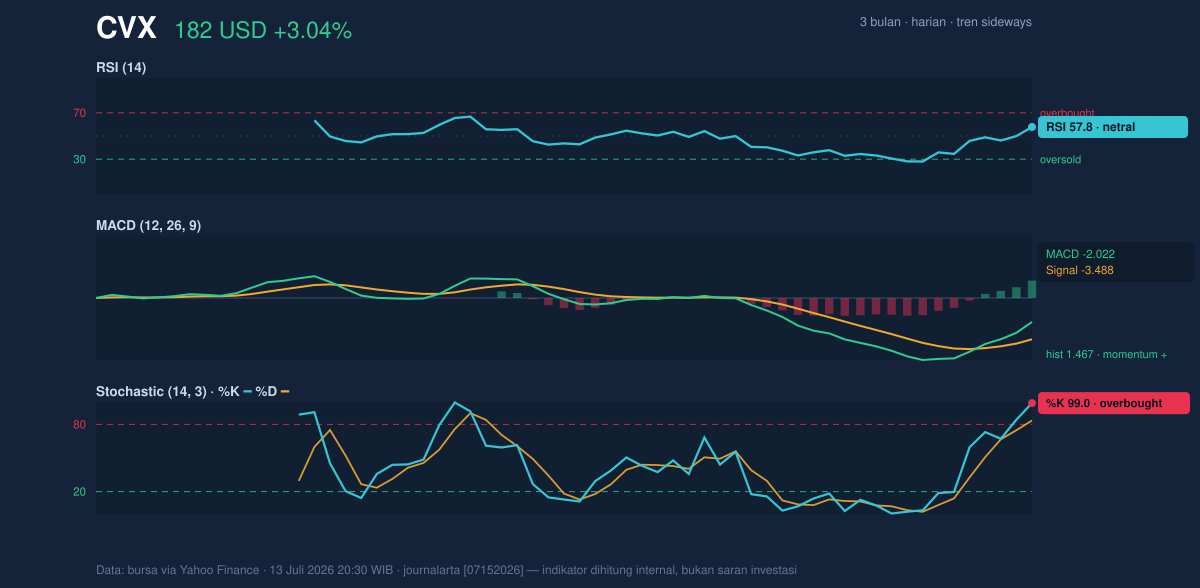
Supporting the recovery effort, the MACD stands at -2.022 with a positive histogram reading of 1.467. Because the MACD line remains above its signal line (-3.488), the momentum is characterized by an ongoing accumulation phase rather than a speculative blow-off top. The absence of a new MA-cross confirms that the market is waiting for a decisive break above the SMA50 before committing to a long-term directional shift.
Volatility and Volume
Market volatility, as measured by the ATR(14) of 3.70, remains at a moderate level, representing roughly 2.0% of the share price. The Bollinger Bands confirm this, with the price currently at 85% of the upper band (185.10 USD). This suggests that the stock is approaching the upper boundary of its current range, implying that buyers may encounter selling pressure as they approach the 185.10 USD threshold.
Volume dynamics offer a point of caution. With a session volume of 7.68 million shares, the stock traded at only 0.8x of its 20-day average, and the OBV (On-Balance Volume) is trending lower. This divergence between price appreciation and lack of volume indicates that the recent rally lacks strong institutional conviction, suggesting that the move may be driven by thin liquidity rather than a broad-based surge in demand.
Key Levels & Scenarios
The current price sits in the upper quartile of the 20-day range. With support at 165.69 USD and resistance at 187.22 USD, the stock is effectively testing the upper bounds of its recovery path. Should the price fail to sustain the level above the SMA20 (174.23 USD), the potential exists for a retest of the lower Bollinger band. Conversely, a breakout above the 187.22 USD resistance would likely attract momentum buyers looking to challenge the 3-month high of 198.87 USD.
Technical Verdict: HOLD (wait & see)
The current market configuration favors a cautious approach, justified by the following indicators:
* Mixed Momentum: While the MACD is signaling positive momentum, the extreme Stochastic reading suggests a short-term cooling-off period is likely.
* Volume Deficiency: The low participation relative to the 20-day average and the falling OBV suggest that the current breakout lacks the "teeth" to sustain a meaningful climb above the SMA50.
* Range Constraint: The stock is operating within a tight Bollinger envelope, making the path toward resistance significantly riskier than the potential for a mean-reversion toward the SMA20.
* *Verdict invalidated if price breaks/falls below 165.69 USD.*
Ideal Parameters:
* Entry Range: 170.00 – 174.00 USD (Seeking a pull-back to the SMA20 support).
* Exit Target (Resistance): 187.22 – 190.00 USD.
* Stop Loss: 164.00 USD (Positioned below the 3-month low of 164.78 USD).
Market participants are currently awaiting further volume confirmation to determine if the stock has the strength to eclipse its immediate resistance levels.
Summary Data CVX
| Last price | 181.76 USD |
| Change 1 day / 5 days / 1 month | 3.04% / 8.13% / -2.18% |
| Trend / MA-cross | sideways / none |
| SMA20 / SMA50 | 174.23 / 182.55 |
| RSI (14) / Stochastic %K | 57.8 / 99.0 |
| Bollinger %B / ATR | 85% / 3.70 |
| Support / Resistance 20 days | 165.69 / 187.22 |
| Data as of | 13 Juli 2026 20:30 WIB |



