Shell Stock Gains 3.57% Today, Testing Key Resistance
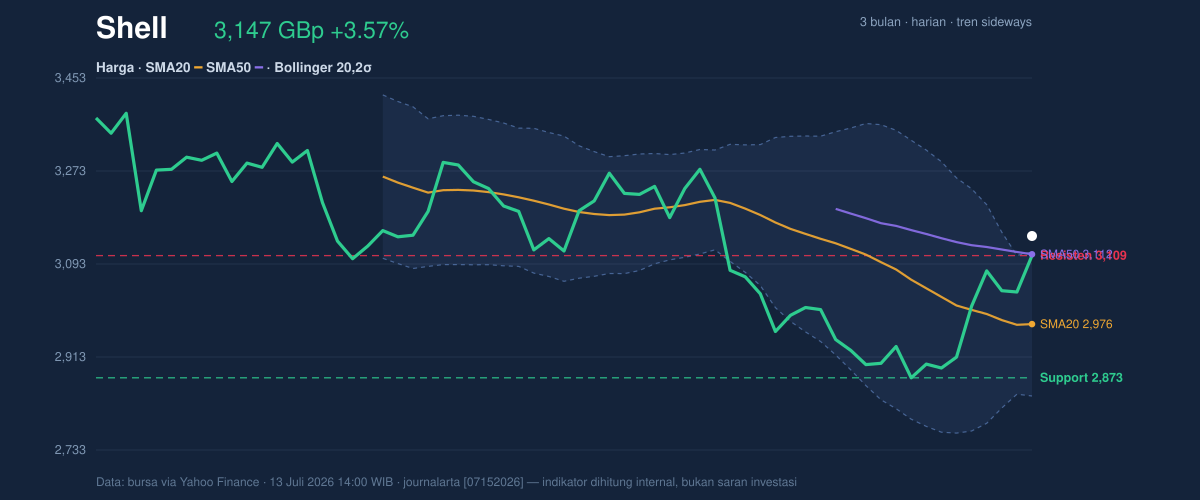
Technical analysis of Shell stock on Juli 15, 2026: price 3,147.00 GBp, trend sideways, RSI 56.8, support 2,872.50, resistance 3,109.00.

Shell plc (SHEL.L) surged 3.57% on the London Stock Exchange, closing at 3,147.00 GBp as institutional appetite returned to the energy major following a period of consolidation. This sharp intraday move pushed the stock decisively above its 50-day Simple Moving Average (SMA50) of 3,111.59, signaling a shift in the short-term supply-demand balance. While the energy sector has grappled with wider macro uncertainty, Shell’s latest performance demonstrates a notable decoupling from its recent sideways drift, supported by an influx of buying volume that clocked in at 1.4 times its 20-day average.
Trend & Price Action
The stock’s current positioning relative to its moving averages reveals a compelling recovery structure. After hovering in a tight consolidation zone, the price has reclaimed its SMA20 (2,976.48) and is now testing territory last seen during the mid-range cycle. By moving above the Bollinger Band upper limit of 3,115.71, Shell has triggered a technical breakout signal, indicating that the recent volatility expansion is biased toward the upside. With the %B sitting at 111%, the stock is technically trading outside its standard deviation bands, suggesting that the recent 8.05% gain over the last five days has created an aggressive momentum pulse that necessitates a test of the 3,109.00 resistance level from a supportive perspective.
Oscillators & Momentum
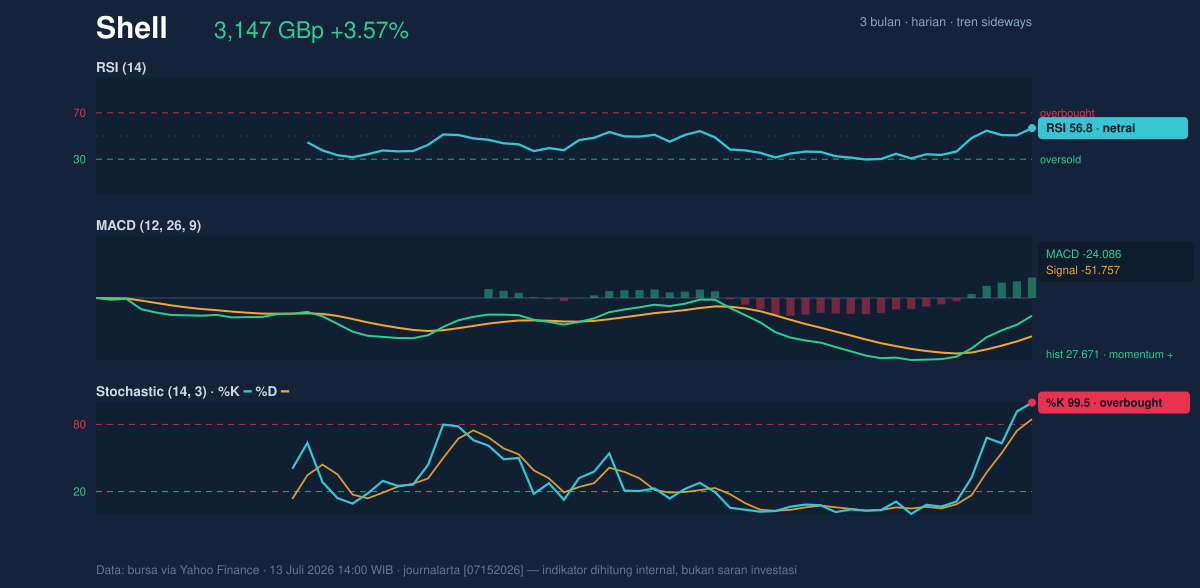
Market sentiment, as captured by technical indicators, displays a mix of strength and caution. The MACD (Moving Average Convergence Divergence) reveals a positive crossover, with the line at -24.086 currently above the signal line of -51.757, creating a positive histogram of 27.671. This suggests that the internal momentum of the stock is building, even as the RSI (14) at 56.8 remains in neutral territory. However, traders should note the Stochastic %K at 99.5 and %D at 84.7; these levels are firmly in overbought territory. Such a reading usually serves as a warning that the rapid ascent may be due for a pause or a minor retracement to consolidate the recent gains before further directional conviction can be established.
Volatility & Volume
The surge in volume to 13,263,049 shares—significantly higher than the 9,641,292 average—confirms that the move is backed by institutional participation rather than thin-market noise. This expansion, paired with the On-Balance Volume (OBV) indicator trending upward, confirms that buyers are aggressively accumulating the stock at these levels. With an ATR (14) of 94.20, the stock is exhibiting moderate volatility, representing approximately 3.0% of its current price. This indicates that while the move is significant, it remains within a controllable risk parameter for market participants. The widening of the Bollinger bands suggests that the period of low-volatility stagnation has ended, giving way to a more dynamic trading environment.
Technical Verdict: HOLD (wait & see)
The current technical configuration for Shell presents a classic 'breakout exhaustion' paradox. While the bullish crossover on the MACD and the surge in volume are undeniably positive, the extreme reading on the Stochastic oscillator suggests that the stock is currently "stretched" and may face short-term profit-taking at these levels.
* Hold Rationale: The stock has successfully broken above the SMA50 and Bollinger upper band; however, the overbought Stochastic (99.5) cautions against chasing the move immediately.
* Invalidation Condition: This cautious stance is invalidated if the price sustains a daily close above 3,150.00, which would signify a true breakout from the resistance zone.
* Strategic Levels:
* Entry Range: 2,980.00 – 3,010.00 (targeting a retest of the broken 3,109.00 resistance turned support).
* Exit Target: 3,250.00 (next psychological resistance).
* Stop Loss: 2,870.00 (below 20-day support level).
Market participants are essentially waiting for the current momentum to "cool off" before committing fresh capital to the next leg of the move.
Disclaimer: This analysis is provided for informational purposes only and does not constitute financial advice or an invitation to trade. All market participation carries risk; please consult a qualified financial advisor.
Summary Data Shell
| Last price | 3,147.00 GBp |
| Change 1 day / 5 days / 1 month | 3.57% / 8.05% / 2.16% |
| Trend / MA-cross | sideways / none |
| SMA20 / SMA50 | 2,976.48 / 3,111.59 |
| RSI (14) / Stochastic %K | 56.8 / 99.5 |
| Bollinger %B / ATR | 111% / 94.20 |
| Support / Resistance 20 days | 2,872.50 / 3,109.00 |
| Data as of | 13 Juli 2026 14:00 WIB |



