Singtel Stock Gains 0.91% Today, Testing Key Resistance
Technical analysis of Singtel stock on Juli 15, 2026: price 4.44 SGD, trend sideways, RSI 51.0, support 4.30, resistance 4.47. Key angle: Singtel Stock Gains.

Singapore Telecom (Singtel) shares on the Singapore Exchange closed at 4.44 SGD this week, reflecting a modest 0.91% daily gain that punctuates a period of consolidation. As the telecommunications giant navigates a complex regional landscape, the stock's current price position relative to its moving averages provides a map for market sentiment. Investors are currently weighing a 3.98% monthly advance against the broader stagnation characterized by the stock’s sideways trend, as indicated by the 0.68% slope of the SMA20 over the last five sessions.
Trend and Price Action
The stock is currently trading in a nuanced position, sitting above the SMA20 of 4.40 SGD but remaining suppressed beneath the SMA50 of 4.49 SGD. This proximity to the SMA50 resistance suggests that the stock is testing a critical structural ceiling. While there is no fresh MA-cross to signal a definitive directional shift, the price action is effectively contained within the upper quartile of its recent trading range.
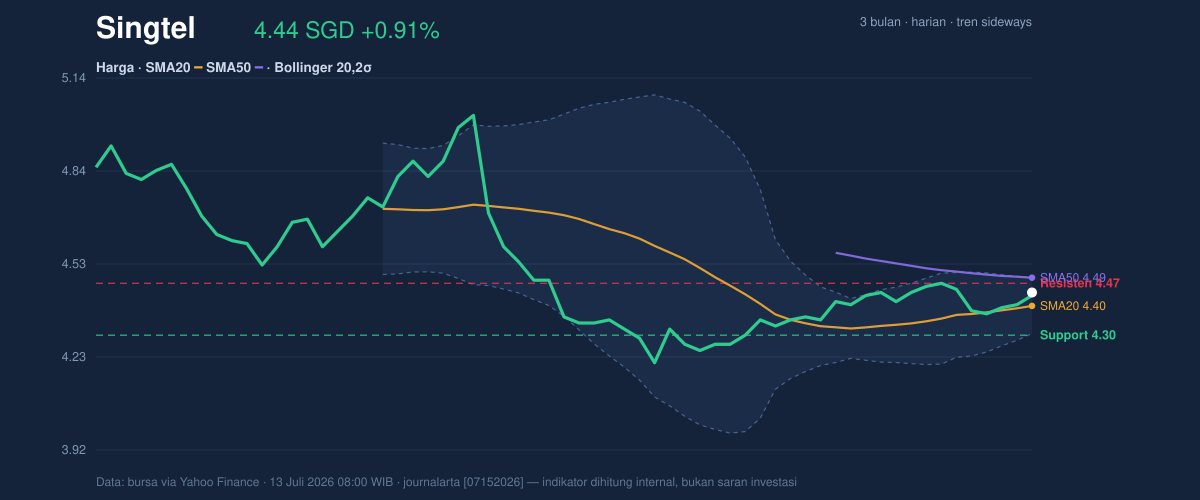
The Bollinger Bands reveal a cooling in market intensity, with a bandwidth of 4.1% signaling a squeeze. In technical analysis, such compression often precedes a period of heightened volatility or a decisive breakout from the current range. With the %B at 74%, the price is gravitating toward the upper band, hinting that bullish participants are currently exerting more pressure than their bearish counterparts, despite the broader sideways regime.
Oscillators and Momentum
Current momentum readings indicate a market in equilibrium rather than a breakout phase. The RSI(14) at 51.0 places the stock firmly in neutral territory, suggesting that neither buyers nor sellers hold a decisive advantage at these levels. Supporting this view, the Stochastic %K at 57.1 and %D at 55.6 offer a non-committal outlook, showing no immediate signs of being overbought or oversold.
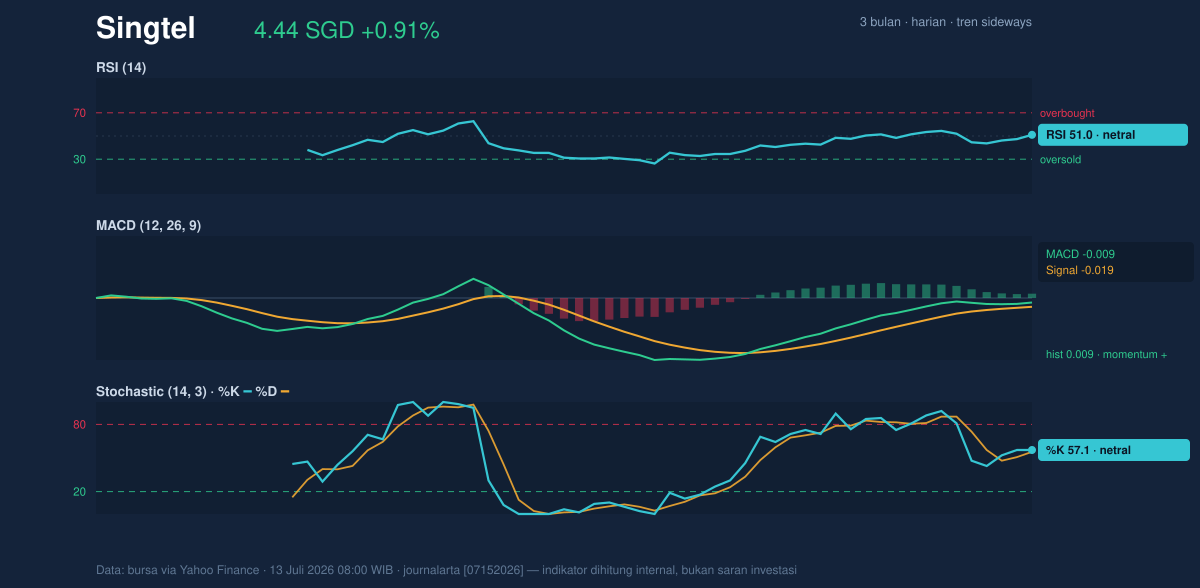
However, the MACD provides a slightly more optimistic nuance. With the MACD line at -0.009 sitting above the signal line at -0.019 and a positive histogram of 0.009, there is a subtle buildup of positive momentum. This alignment often serves as a precursor to sustained price appreciation if external volume supports the move.
Volatility and Volume
Market participation appears to be ticking higher, as evidenced by the 28,573,000 shares traded, which represents 1.1x the 20-day average volume. An upward-trending OBV (On-Balance Volume) confirms that the recent accumulation is not mere noise but reflects meaningful institutional or retail conviction. With an ATR(14) of 0.07, Singtel is experiencing moderate volatility—roughly 1.6% of its share price—which indicates that the current price stability is not due to market inactivity but rather a disciplined tug-of-war between supply and demand.
Key Levels and Scenarios
For market participants, the path ahead is defined by two primary frontiers. The immediate hurdle is the resistance at 4.47 SGD, which aligns closely with the SMA50 and the upper Bollinger band. A clean break above this level could invalidate the current sideways structure and invite further testing of the 3-month high of 5.05 SGD. Conversely, if the price fails to hold the support at 4.30 SGD, the technical posture would weaken, potentially exposing the stock to the lower end of its recent 3-month range at 4.15 SGD.
Technical Verdict: HOLD (wait & see)
The current setup warrants a HOLD (wait & see) posture based on the following indicators:
* Neutral Oscillators: Both the RSI and Stochastic remain in the mid-range, suggesting no immediate breakout momentum.
* Resistance Proximity: The price is bumping against the SMA50 resistance at 4.49 SGD, requiring a breakout on sustained high volume before a definitive shift in bias.
* Verdict Invalidation: This technical view is invalidated if the price decisively breaks above the 4.49 SGD level or falls below the 4.30 SGD support floor.
This verdict translates to a market that is currently searching for a catalyst to break its recent tight-range pattern.
Singtel's next major test will be whether the 28.5 million volume spike can sustain a push through the 4.47 SGD resistance level.
Summary Data Singtel
| Last price | 4.44 SGD |
| Change 1 day / 5 days / 1 month | 0.91% / -0.22% / 3.98% |
| Trend / MA-cross | sideways / none |
| SMA20 / SMA50 | 4.40 / 4.49 |
| RSI (14) / Stochastic %K | 51.0 / 57.1 |
| Bollinger %B / ATR | 74% / 0.07 |
| Support / Resistance 20 days | 4.30 / 4.47 |
| Data as of | 13 Juli 2026 08:00 WIB |



