UOB Stock Analysis: Drops 0.00%, RSI Overbought
Technical analysis of UOB stock on Juli 15, 2026: price 44.38 SGD, trend uptrend, RSI 81.3, support 39.00, resistance 44.38. Key angle: UOB Stock Analysis.

United Overseas Bank (U11.SI) closed unchanged at 44.38 SGD on the Singapore Exchange as of July 13, 2026, marking a pause in what has been a aggressive climb for the lender. Having gained 15.42% over the past month and 9.53% in just the last five days, the stock is currently testing the upper boundaries of its recent trading range. This rapid ascent reflects a significant shift in market sentiment, though the current price position relative to technical indicators suggests the bank is now navigating a period of heightened intensity.
Trend & Price Action
UOB’s current structure is defined by a clear uptrend, with the price comfortably positioned above both the SMA20 of 40.70 and the SMA50 of 38.84. The 5-day slope of the SMA20 at 3.40% underscores the speed of this recent rally. With the price currently resting exactly at the resistance level of 44.38—which coincides with its 20-day high and nears the 3-month peak of 44.58—the market is effectively deciding whether this momentum can sustain a breakout.
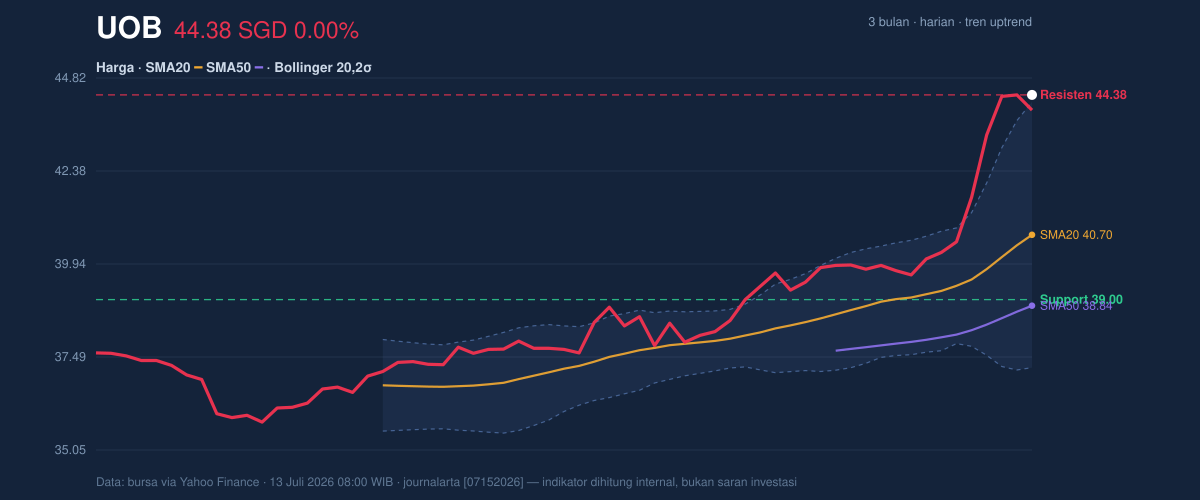
The stock is currently trading at 103% of the Bollinger Band range, indicating that the price has pierced the upper band of 44.19. In technical analysis, a %B value above 100% often signals that the asset is pushing against the limits of its statistical norm, suggesting that while the trend is strong, the velocity may be approaching an exhaustion point.
Oscillators & Momentum
Momentum indicators provide a nuanced look at the intensity of this move. The RSI(14) at 81.3 places the stock firmly in overbought territory, a zone that typically warns of a potential cooling period or a consolidation phase. Similarly, the Stochastic %K at 88.4 and %D at 95.6 confirm this stretched condition.
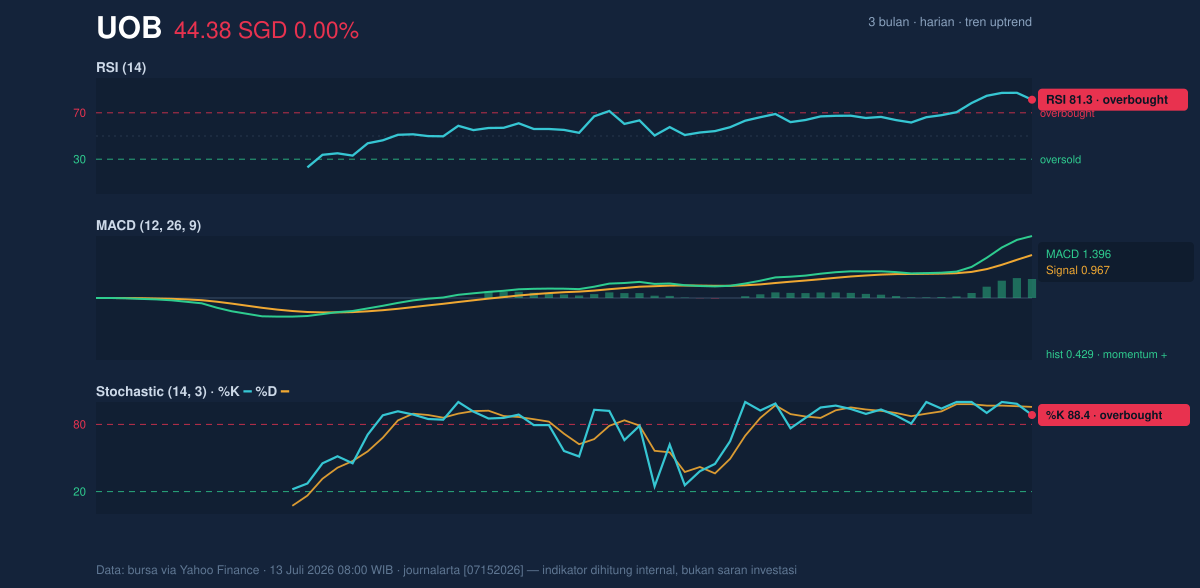
However, the MACD of 1.396 remains above the signal line of 0.967, and the positive histogram of 0.429 demonstrates that the underlying buying pressure has not yet evaporated. The alignment of the MACD suggests that while oscillators indicate a short-term overextension, the primary trend remains fundamentally bullish, supported by a healthy On-Balance Volume (OBV) that continues to trend upward.
Volatility & Volume
Market participation remains stable, with the latest volume of 3,082,100 units aligning with the 20-day average of 3,162,081. This 1.0x volume ratio indicates that the recent gains were achieved through sustained institutional interest rather than a speculative, low-volume spike. With an ATR(14) of 0.70, representing approximately 1.6% of the share price, the bank is experiencing moderate volatility. The Bollinger Band width of 17.1% is categorized as normal, suggesting that the current rally is not yet indicative of a runaway parabolic move, but rather a robust, if rapid, repricing.
Key Levels & Scenarios
Given the stock’s current position at the 44.38 resistance, the next moves will be critical. If the price fails to hold 44.38 and begins to retreat, the support level at 39.00—the 20-day support—will likely act as the first major line of defense. Conversely, a sustained break and daily close above 44.38 would signal the beginning of a new leg higher, likely targeting the 3-month high of 44.58.
Technical Verdict: HOLD (wait & see)
The HOLD (wait & see) verdict is driven by the fact that the stock is currently overbought with an RSI of 81.3 and a %B of 103%, indicating that the price has moved significantly ahead of its moving averages. While the MACD positive momentum confirms the strength of the trend, the high probability of a mean-reversion suggests that entry at current levels carries elevated risk. This verdict is invalidated if the price falls below the 39.00 support level, which would suggest a formal breakdown of the current momentum. In plain English, the stock has moved too fast, too soon, and it is prudent to wait for a temporary dip or a period of sideways movement before expecting further sustained gains.
***
*Disclaimer: This analysis is provided for informational purposes only and does not constitute financial or investment advice. JournalArta does not endorse any specific financial product or strategy. Technical indicators are based on historical data and do not guarantee future performance.*
Summary Data UOB
| Last price | 44.38 SGD |
| Change 1 day / 5 days / 1 month | 0.00% / 9.53% / 15.42% |
| Trend / MA-cross | uptrend / none |
| SMA20 / SMA50 | 40.70 / 38.84 |
| RSI (14) / Stochastic %K | 81.3 / 88.4 |
| Bollinger %B / ATR | 103% / 0.70 |
| Support / Resistance 20 days | 39.00 / 44.38 |
| Data as of | 13 Juli 2026 08:00 WIB |



