GOOGL Stock Technicals Today: Gains 3.17%, Testing Key Resistance
On Juli 16, 2026: price 370.92 USD, trend sideways, RSI 57.0, support 337.39, resistance 373.25. technical analysis of googl stock. Key angle: GOOGL Stock…

Alphabet (GOOGL) shares staged a notable recovery during the latest session, climbing 3.17% to reach a last price of 370.92 USD. This move arrives as the market recalibrates the stock's position relative to its medium-term averages, reflecting a struggle for directional conviction after a period of consolidation. While the broader technology sector remains sensitive to macro-economic headwinds, the recent price action indicates a decisive push off the support floor established over the last three months.
Trend & Price Action
The current market architecture for GOOGL is defined by a sideways trend, as evidenced by the minimal -0.12% slope over the last five days on the 20-day Simple Moving Average (SMA20). Trading at 370.92 USD, the stock has successfully reclaimed its position above the SMA20 of 357.69, a development that often acts as a prerequisite for a return to bullish momentum. However, the stock remains pinned just below the SMA50 of 372.00, creating a technical "no man’s land" where the stock must overcome the immediate gravity of its longer-term average before a breakout can be confirmed.
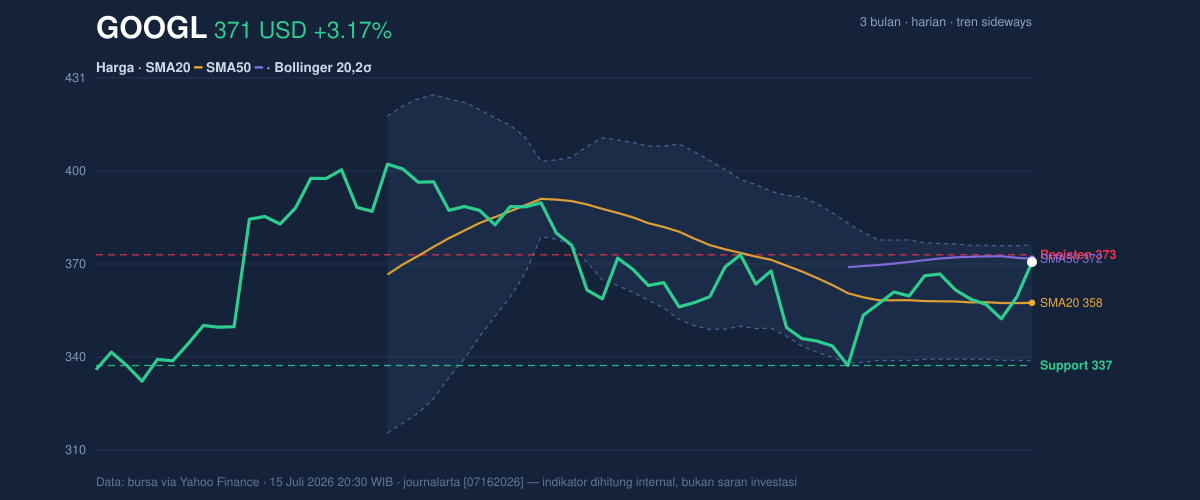
Price action is currently testing the upper reaches of its established range. With the stock sitting at 94% of its 20-day support/resistance range, the bulls are clearly in control of the short-term narrative, but are bumping against the 373.25 resistance level.
Oscillators & Momentum
Momentum indicators provide a nuanced picture of the current rally. The RSI(14) sits at 57.0, comfortably in neutral territory, suggesting that there is still room for further appreciation before the stock enters technically overbought conditions. Conversely, the Stochastic oscillator, with %K at 93.7 and %D at 71.3, is flashing a warning sign of an overbought condition, implying that the rapid ascent of the last 24 hours may face a cooling-off period.
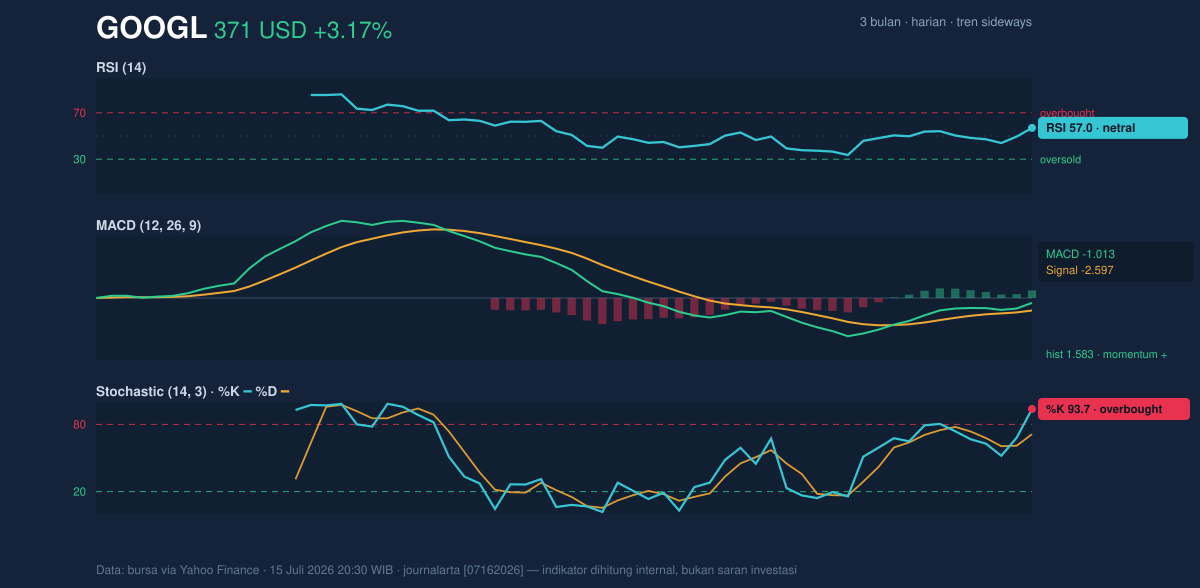
Providing a crucial counterbalance is the MACD, which displays a positive momentum configuration. With the MACD line at -1.013 sitting above the signal line of -2.597, the expansion of the histogram to 1.583 confirms that the buying pressure is not merely noise but is backed by a strengthening underlying trend.
Volatility & Volume
The volatility profile remains measured. The Bollinger Bands show an upper threshold at 376.50, while the %B at 85% indicates that the stock is testing the outer edge of its expected movement range. With an ATR(14) of 10.34, the stock is exhibiting moderate volatility—roughly 2.8% of its price—suggesting that while moves are significant, they remain within standard statistical expectations for a large-cap entity.
Participation levels, however, invite caution. Trading volume stands at 28,274,200, which is approximately 0.8x the 20-day average. In technical terms, a breakout occurring on below-average volume is frequently viewed with skepticism. Despite this, the OBV (On-Balance Volume) is trending upward, suggesting that while institutional participation is subdued, the accumulation of shares continues to outpace distribution.
Technical Verdict: HOLD (wait & see)
The technical outlook for Alphabet reflects a company at a crossroads, caught between short-term bullish momentum and a lack of conviction from high-volume participants.
* Reasons: The stock faces significant resistance at 373.25 and the SMA50 of 372.00, combined with an overbought Stochastic reading that suggests a short-term pullback is likely before any sustained move higher.
* Invalidation: The neutral outlook is invalidated if the price decisively breaks above 376.50 (Upper Bollinger Band) on high volume or falls below the SMA20 support of 357.69.
* Entry/Exit Parameters:
* Entry Range: 358.00 – 362.00 USD (waiting for a retest of the SMA20).
* Exit Target: 373.25 USD (immediate resistance) then 376.50 USD.
* Stop Loss: 350.00 USD (to protect against a breakdown of the current consolidation base).
Until the stock can push through its overhead resistance with heavier volume, the path of least resistance is likely to be a period of lateral movement.
Summary Data GOOGL
| Last price | 370.92 USD |
| Change 1 day / 5 days / 1 month | 3.17% / 2.49% / 0.43% |
| Trend / MA-cross | sideways / none |
| SMA20 / SMA50 | 357.69 / 372.00 |
| RSI (14) / Stochastic %K | 57.0 / 93.7 |
| Bollinger %B / ATR | 85% / 10.34 |
| Support / Resistance 20 days | 337.39 / 373.25 |
| Data as of | 15 Juli 2026 20:30 WIB |



