Golden Cross Formed, AAPL Stock Gains 4.01% Today
On Juli 16, 2026: price 327.50 USD, trend uptrend, RSI 68.8, support 275.15, resistance 327.50. technical analysis of aapl stock. Key angle: Golden Cross…

Apple Inc. (AAPL) surged to 327.50 USD on the NASDAQ, marking a robust 4.01% single-day gain as trading activity intensified near the upper boundary of its three-month range. This move reflects a decisive break from consolidation, placing the equity firmly in the hands of momentum buyers. The tech giant is currently testing its primary overhead ceiling.
Trend and Price Structure
The stock’s technical landscape is currently defined by a structural shift toward a more aggressive uptrend. With the price now sitting at 327.50 USD—well above both the SMA20 of 301.93 and the SMA50 of 300.53—the recent Golden Cross (where the 20-day average crossed above the 50-day) confirms a strengthening medium-term bullish bias. The SMA20 slope of 2.13% over the last five days highlights an accelerating move, suggesting that institutional interest has transitioned from accumulation to active pursuit.
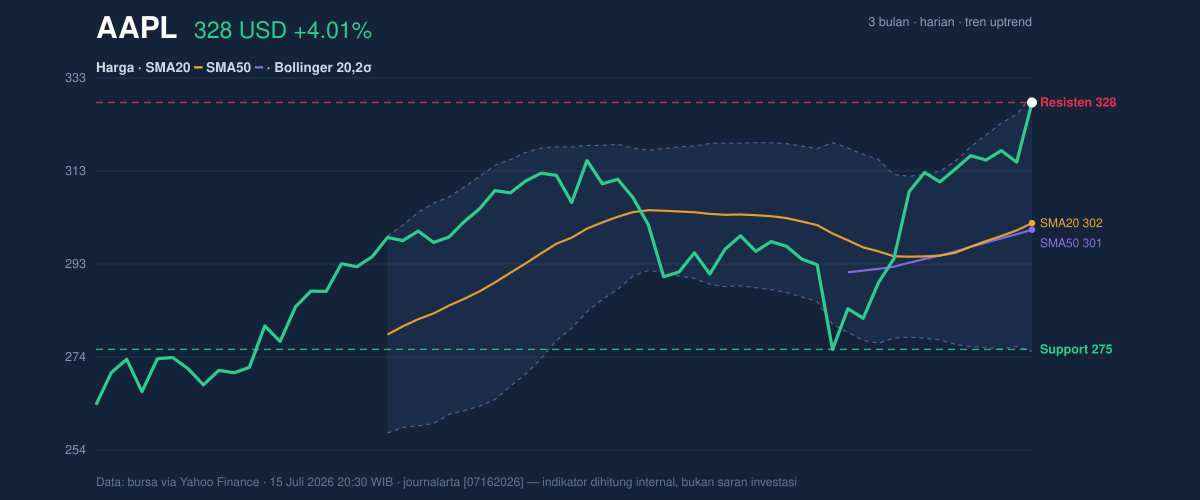
The price sits at the 100% level of the current 20-day trading range, effectively brushing against the Bollinger Band upper limit of 329.12. When an asset trades at a %B of 97%, it signals that the market is currently priced at the extreme upper bound of its statistical volatility, implying that while the momentum is undeniably strong, the stock is currently "stretched" relative to its recent mean.
Oscillators and Momentum
Momentum is heavily skewed to the upside, though participants should note the cooling-off potential indicated by oscillators. The MACD is at 6.554, comfortably above the signal line of 3.765, with a growing positive histogram of 2.789. This divergence confirms that the current price appreciation is supported by underlying trend strength rather than a fleeting spike.
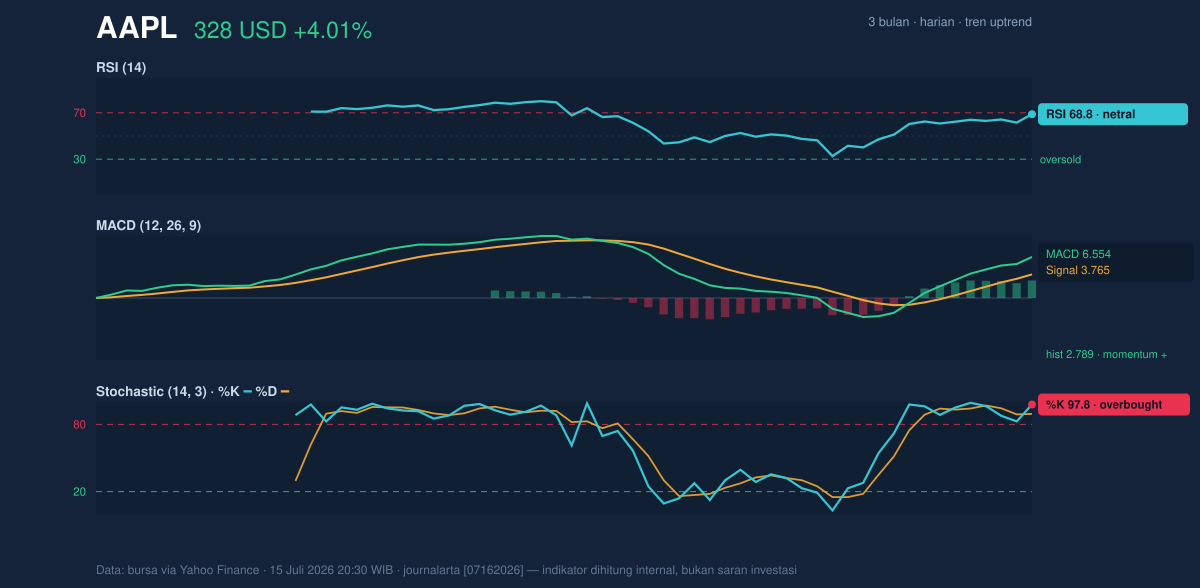
Conversely, the RSI(14) of 68.8 is approaching the threshold of overbought territory, while the Stochastic %K at 97.8 and %D at 89.4 are already signaling overbought conditions. In financial analysis, these readings suggest that the immediate "gas" behind the rally is nearing exhaustion. If these levels do not correct through price consolidation, the risk of a temporary pullback or a "mean reversion" toward the SMA20 support increases.
Volatility and Volume
Volatility remains moderate, with an ATR(14) of 9.48, representing roughly 2.9% of the share price. Interestingly, the trading volume of 60,884,500 remains slightly below the 20-day average of 65,226,360, registering at 0.9x normal. While the OBV (On-Balance Volume) is rising—indicating that buying pressure is successfully offsetting selling volume—the lack of high-volume conviction on today’s 4% move suggests that traders should remain cautious of a "breakout failure" if volume does not expand as the stock attempts to clear the 328.73 three-month high.
Technical Verdict: HOLD (wait & see)
The current stance is a HOLD, based on the following technical observations:
* Overbought Momentum: Both Stochastic and RSI metrics indicate the stock is technically overextended in the very short term, increasing the probability of a localized price correction.
* Resistance Proximity: The price is currently pinned against the 327.50 USD resistance and the Bollinger upper band, leaving little room for immediate further upside without a consolidation phase.
* Volume Divergence: The failure of volume to exceed the 20-day average during a significant 4% rally acts as a minor red flag for sustainability.
Verdict invalidated if the price breaks decisively above the 328.73 high on high volume.
* Entry Range: 301.93 – 305.00 (targeting a pullback toward the SMA20)
* Exit Target: 335.00 (projected extension)
* Stop Loss: 295.00 (below the SMA50/SMA20 confluence)
The market is signaling that while Apple has regained strong bullish momentum, the stock is currently entering a "resting phase" where prices are likely to consolidate before attempting any further breakout beyond current three-month peaks.
Summary Data AAPL
| Last price | 327.50 USD |
| Change 1 day / 5 days / 1 month | 4.01% / 4.50% / 10.49% |
| Trend / MA-cross | uptrend / golden |
| SMA20 / SMA50 | 301.93 / 300.53 |
| RSI (14) / Stochastic %K | 68.8 / 97.8 |
| Bollinger %B / ATR | 97% / 9.48 |
| Support / Resistance 20 days | 275.15 / 327.50 |
| Data as of | 15 Juli 2026 20:30 WIB |


