MRK Stock Technicals Today: Gains 2.34%, Momentum Weakens
On Juli 16, 2026: price 123.61 USD, trend uptrend, RSI 51.9, support 113.87, resistance 129.56. technical analysis of mrk stock. Key angle: MRK Stock…

Merck (MRK) shares reclaimed momentum on the NYSE during the most recent session, closing at 123.61 USD, a notable 2.34% advance that helped stabilize the stock after a soft five-day period. As a bellwether for the global pharmaceutical sector, Merck’s current price action reflects a delicate balance between fundamental resilience and the tug-of-war typical of a cooling inflationary environment. Trading activity is currently defined by the stock’s ability to hover above its key moving averages, signaling that while institutional conviction remains, the market is waiting for a clear catalyst to push past recent overhead constraints.
Trend and Price Action
The structural health of Merck’s chart is currently defined by a firm positioning above the SMA50 of 118.95 USD, confirming a long-term constructive posture. By trading at 123.61 USD, the stock is comfortably sitting above its SMA20 of 123.29 USD, effectively reclaiming the midline of its Bollinger Band range. This suggests the recent dip below the SMA20 was a temporary deviation rather than a breakdown of the primary trend. With a 3-month high of 130.29 USD within reach, the current price is situated in the 62% tier of its recent trading range, indicating a neutral zone where neither the bulls nor the bears hold absolute dominance.
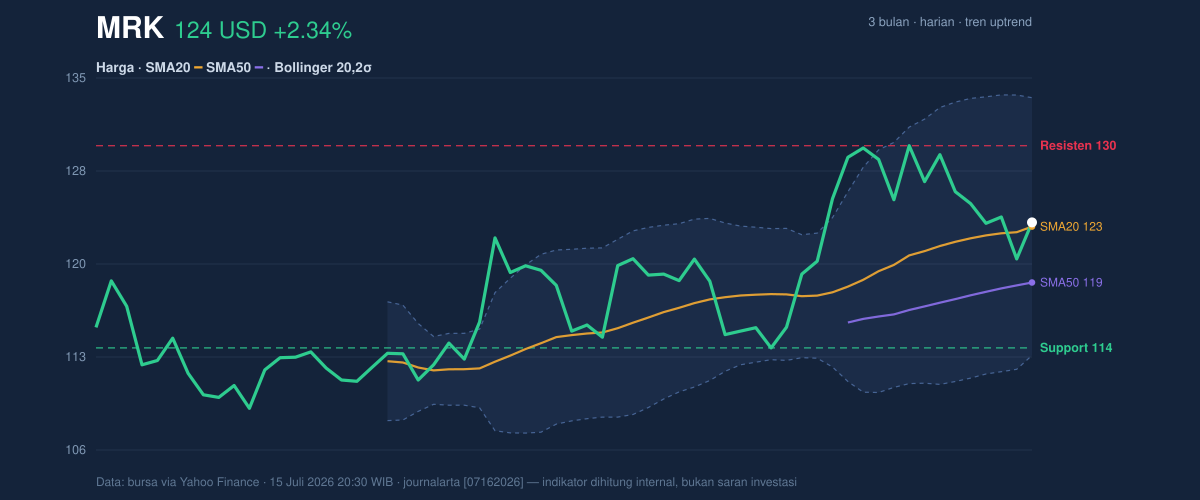
The slope of the SMA20 (0.97% over 5 days) indicates a subtle upward bias, suggesting that the stock is in a period of consolidation following its recent monthly gain of 7.58%. As long as price remains anchored above the 118.95 USD support floor, the upward bias remains intact.
Oscillators and Momentum
The internal indicators for Merck reveal a tug-of-war between price stability and weakening momentum. The RSI(14) at 51.9 sits firmly in neutral territory, suggesting that the stock is neither overstretched nor oversold. This lack of extremes is mirrored by the Stochastic (%K 34.1 / %D 33.4), which is hovering at the lower end of the neutral spectrum, indicating that the stock has finished its immediate correction and is currently searching for a new direction.
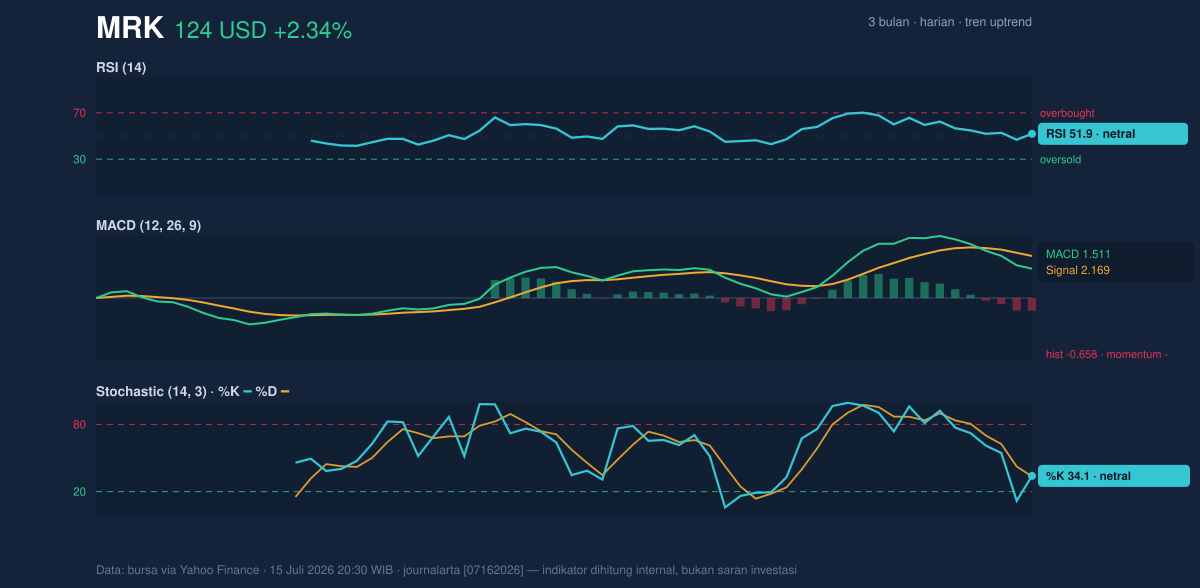
A more cautious signal arrives from the MACD, currently at 1.511, which remains below its signal line of 2.169. The negative MACD histogram of -0.658 is a technical warning sign that downward momentum has yet to be fully extinguished, despite the daily price gains. Investors should monitor this closely; until the MACD crosses back above the signal line, the stock may lack the velocity required to challenge the upper Bollinger Band resistance of 133.29 USD.
Volatility and Volume
Market participation has been somewhat restrained, with a daily volume of 9,053,300 shares, which is only 0.8x the 20-day average. This contraction in volume is a double-edged sword: it suggests a lack of aggressive selling pressure, but also a lack of the "conviction buying" needed to drive a sustained breakout. Simultaneously, the OBV (On-Balance Volume) is trending lower, hinting that institutional players may be distributing shares during these recovery rallies. With the ATR(14) at 3.66, the stock’s daily volatility is within a standard 3% range, keeping the risk of a breakout or breakdown confined to predictable bounds.
Technical Verdict: HOLD (wait & see)
The technical picture for Merck is currently characterized by a struggle between a solid trend and flagging momentum. While the stock holds key support levels, the lack of volume and negative MACD signal suggest a period of sideways movement is the most likely path forward.
* Entry Range: Wait for a retest near the SMA20 (123.29 USD) or a move toward the support level at 118.95 USD if volume increases.
* Target Price: The immediate overhead resistance sits at 129.56 USD, with a secondary objective at the upper Bollinger Band of 133.29 USD.
* Stop Loss: A protective position below the 20-day support of 113.87 USD would be prudent to mitigate risk.
* Verdict Invalidation: The hold stance is invalidated if the price decisively closes below 118.95 USD, as this would break the 50-day moving average and signal a deeper bearish rotation.
In plain terms, Merck is currently resting in a "wait-and-see" phase; until volume returns and the momentum indicators flip from negative to positive, the stock is likely to trade within its existing channel rather than initiating a new trend.
Summary Data MRK
| Last price | 123.61 USD |
| Change 1 day / 5 days / 1 month | 2.34% / -1.89% / 7.58% |
| Trend / MA-cross | uptrend / none |
| SMA20 / SMA50 | 123.29 / 118.95 |
| RSI (14) / Stochastic %K | 51.9 / 34.1 |
| Bollinger %B / ATR | 52% / 3.66 |
| Support / Resistance 20 days | 113.87 / 129.56 |
| Data as of | 15 Juli 2026 20:30 WIB |



