AstraZeneca Stock Drops 0.35% Today, Momentum Weakens
On Juli 16, 2026: price 12,566.00 GBp, trend sideways, RSI 32.0, support 12,364.00, resistance 14,538.00. technical analysis of astrazeneca stock.

AstraZeneca’s shares on the London Stock Exchange have faced significant selling pressure, closing at 12,566.00 GBp following a difficult week that saw the stock decline by 12.52%. Market participants are recalibrating their positions as the pharmaceutical giant trades well below its key moving averages, signaling a shift in institutional sentiment that has pushed the price to the lower end of its recent trading range.
Trend and Price Action
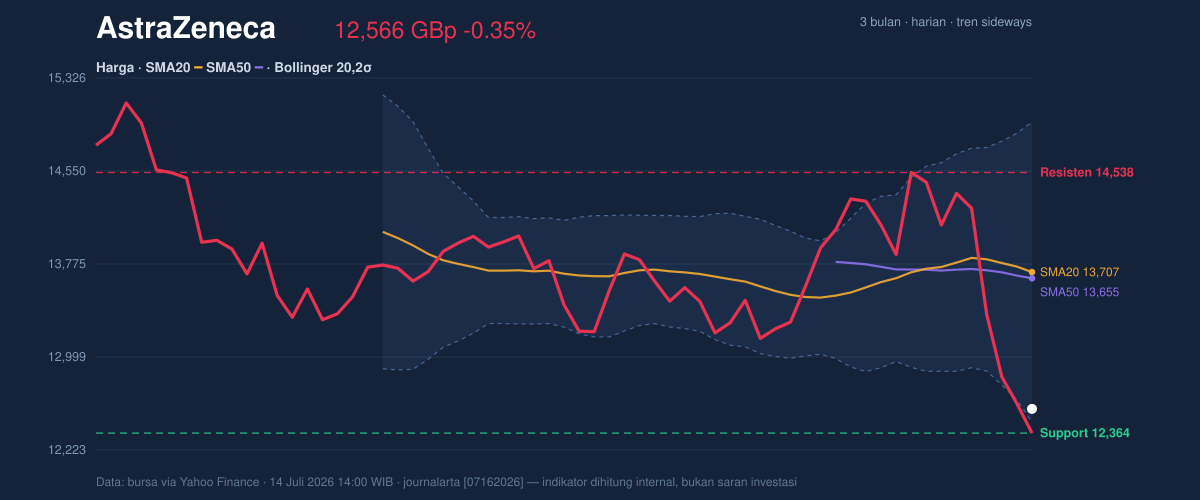
The stock is currently navigating a fragile environment, trading significantly beneath both the SMA20 of 13,707.10 GBp and the SMA50 of 13,655.28 GBp. This positioning beneath its short-term and medium-term averages confirms a lack of upward momentum, as the negative slope of the SMA20 suggests that rallies are currently being met with renewed distribution. With the price hovering near the lower threshold of the Bollinger Bands—evidenced by a %B reading of 4%—the stock is flirting with levels that historically trigger short-term stabilization or technical bounces, yet the absence of a bullish MA-cross keeps the broader structure firmly in a defensive posture.
Oscillators and Momentum
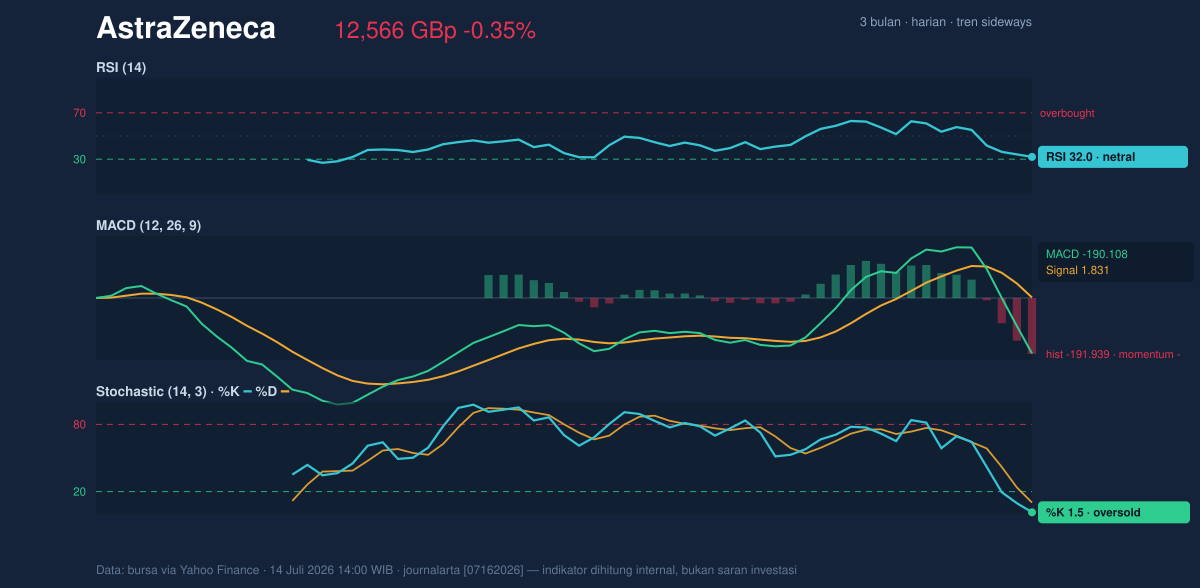
Technical indicators reveal a market that has been aggressively liquidated over the past five trading days. The RSI(14) at 32.0 sits just above the traditional threshold for "oversold" territory, while the Stochastic oscillator at 1.5/10.2 provides a more acute signal, confirming that the asset is deeply oversold. Despite these extreme levels, the MACD histogram at -191.939 continues to print deep negative values, indicating that the selling momentum has not yet decelerated. Investors should monitor whether the Stochastic can reclaim the 20-level, which would act as the first sign of exhausted bearish dominance.
Volatility and Volume
The volatility profile has expanded sharply, with the ATR(14) at 512.29, representing a substantial 4.1% daily movement relative to the share price. This elevated volatility is underscored by participation metrics; the latest trading volume of 3,313,274 shares is roughly 1.3 times the 20-day average. The concurrent decline in OBV (On-Balance Volume) confirms that this surge in activity is driven by net selling rather than accumulation. As the stock approaches the support level of 12,364.00 GBp, the combination of high volume and lower prices suggests that bearish conviction remains high, despite the stock's proximity to its lower Bollinger boundary of 12,453.80 GBp.
Technical Verdict: HOLD (wait & see)
The current technical configuration for AstraZeneca warrants caution. While the stock is technically oversold, the lack of a stabilizing candlestick pattern or a reversal in the MACD suggests that catching this knife could be premature.
* Reasons: Deeply oversold Stochastic status suggests potential for a bounce; however, price remains firmly below all major moving averages, and the OBV confirms sustained distribution.
* Invalidation: The bearish outlook remains active unless the price decisively reclaims the 12,453.80 GBp lower Bollinger Band level with increased buy-side volume.
* Entry Range: Observe for consolidation between 12,364.00 GBp and 12,453.80 GBp.
* Exit Target: 13,655.28 GBp (SMA50 resistance).
* Stop Loss: 12,150.00 GBp (protection against a breakdown of the 3-month support structure).
The current price action reflects a period of aggressive volatility where the market is testing whether the 12,364.00 GBp support level can hold against the weight of recent selling volume.
Summary Data AstraZeneca
| Last price | 12,566.00 GBp |
| Change 1 day / 5 days / 1 month | -0.35% / -12.52% / -5.40% |
| Trend / MA-cross | sideways / none |
| SMA20 / SMA50 | 13,707.10 / 13,655.28 |
| RSI (14) / Stochastic %K | 32.0 / 1.5 |
| Bollinger %B / ATR | 4% / 512.29 |
| Support / Resistance 20 days | 12,364.00 / 14,538.00 |
| Data as of | 14 Juli 2026 14:00 WIB |



