ADBE Testing Key Resistance: Stock Gains 4.79% (Juli 17, 2026)
On Juli 17, 2026: price 235.31 USD, trend sideways, RSI 60.1, support 193.41, resistance 235.31. technical analysis of adbe stock. Key angle: ADBE Testing Key…

Adobe (ADBE) shares surged to 235.31 USD on the NASDAQ exchange as of July 16, 2026, marking a robust daily gain of 4.79% and signaling a decisive test of near-term overhead constraints. This jump comes on the back of a broader monthly recovery of 13.50%, reflecting a shift in investor sentiment as the stock works to reclaim lost ground within its three-month range of 190.12 USD to 275.44 USD.
Trend & Price Action
The price structure is currently transitioning from a period of consolidation into a potential breakout phase. Trading at 235.31 USD, Adobe has successfully vaulted above both its SMA20 of 211.84 USD and its SMA50 of 230.94 USD. By positioning itself above these key moving averages, the stock has effectively neutralized the bearish bias that characterized the earlier half of the quarter. The SMA20 is currently sloping upward at 1.56% over five days, indicating that the short-term trend is gathering steam.
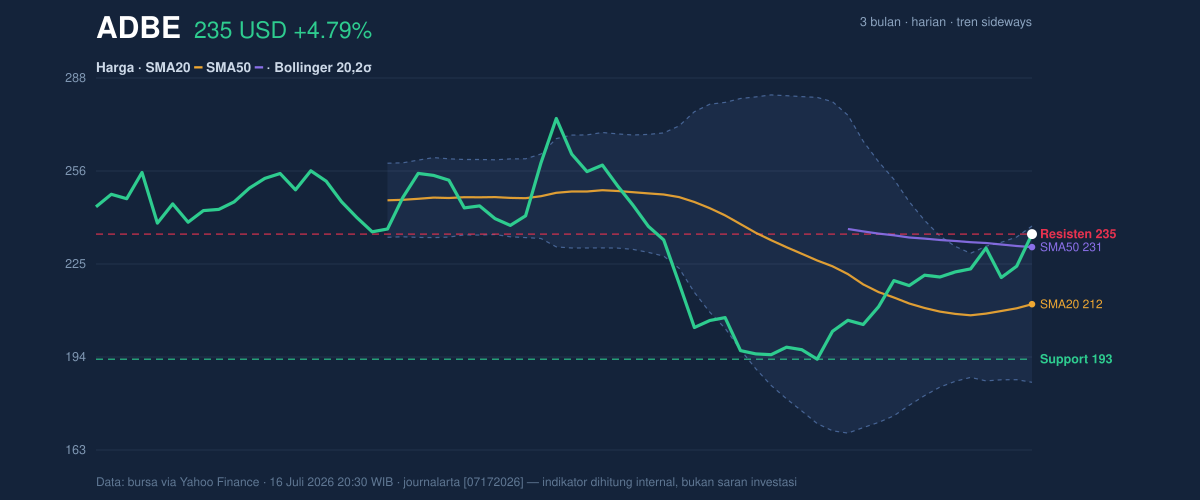
However, the stock is currently hugging the upper boundary of its volatility channel. With the Bollinger Band upper limit situated at 238.01 USD and a %B of 95%, the stock is approaching a state of mechanical resistance where price often tends to compress. The widening of the Bollinger bands—now at 24.7% width—confirms that market participants are aggressively adjusting their valuation of the stock, leading to higher-than-average intraday swings.
Oscillators & Momentum
While the trend shows strength, the momentum indicators offer a more nuanced warning. The RSI(14) at 60.1 maintains a healthy, neutral-to-bullish posture, suggesting that the recent price rally is not yet exhausted from an extreme overbought perspective. In contrast, the Stochastic oscillator (%K 99.6 / %D 84.3) has pushed deep into overbought territory. When the Stochastic indicator hits such extreme levels, it often suggests that the rapid ascent is outpacing the underlying supply-demand equilibrium, leaving the stock vulnerable to a temporary cooling-off period.
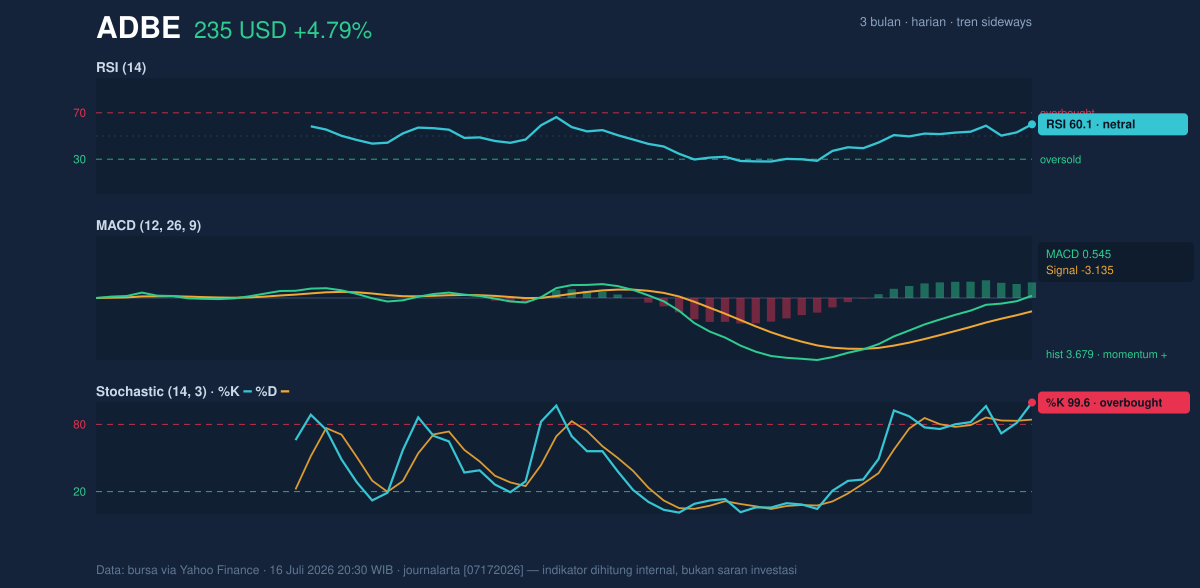
Providing a counter-balance to the Stochastic signals, the MACD sits at 0.545, having crossed above its signal line of -3.135. The positive histogram of 3.679 confirms that the bullish momentum is currently the dominant force driving the stock. This divergence between the cooling-off signal of the Stochastic and the sustained momentum of the MACD suggests that while the stock is technically "stretched" in the short term, the institutional appetite—as reflected in the rising On-Balance Volume (OBV)—remains committed to the current trajectory.
Volatility & Volume
The volatility profile remains elevated, with an ATR(14) of 9.11, representing roughly 3.9% of the share price. This level of fluctuation necessitates a wider stop-loss approach to avoid being shaken out by routine noise. Interestingly, the daily volume of 5,780,100 remains at 0.8x the 20-day average, indicating that while the price is rising, the move is occurring on lighter participation than the recent trend-average. This light-volume breakout requires careful monitoring; a sustained move above the 235.31 USD resistance would ideally be accompanied by a surge in volume to confirm that the breakout is genuine rather than a liquidity-driven spike.
Technical Verdict: HOLD (wait & see)
The current technical configuration is balanced between strong momentum and impending resistance. The verdict is a HOLD based on the following:
* Resistance Proximity: The stock is testing the immediate 235.31 USD resistance level, making a breakout uncertain without higher volume participation.
* Overbought Risk: The Stochastic (99.6) suggests that the stock is overdue for a short-term mean reversion or consolidation before attempting to move higher.
* Invalidation: This neutral view is invalidated if the price closes decisively above the 238.01 USD Bollinger Band level on high volume, signaling a true trend reversal.
Operational Parameters:
* Entry Range: Await a pullback toward the SMA50 (230.94 USD) or a clean break/retest of 238.01 USD.
* Exit Target (Resistance): 275.44 USD (3-month high).
* Stop Loss: Below 211.84 USD (SMA20 support).
Investors should note that the current price action is essentially "testing the ceiling," meaning the path of least resistance will be determined by whether the stock can hold these gains during the next session of high-volume trading.
Summary Data ADBE
| Last price | 235.31 USD |
| Change 1 day / 5 days / 1 month | 4.79% / 5.69% / 13.50% |
| Trend / MA-cross | sideways / none |
| SMA20 / SMA50 | 211.84 / 230.94 |
| RSI (14) / Stochastic %K | 60.1 / 99.6 |
| Bollinger %B / ATR | 95% / 9.11 |
| Support / Resistance 20 days | 193.41 / 235.31 |
| Data as of | 16 Juli 2026 20:30 WIB |



