MRK Stock Gains 3.25% Today, Testing Key Resistance
On Juli 17, 2026: price 127.63 USD, trend uptrend, RSI 57.9, support 113.87, resistance 129.56. technical analysis of mrk stock. Key angle: MRK Stock Gains.

Merck (MRK) shares surged to 127.63 USD in the latest trading session, a 3.25% daily advance that signals renewed investor appetite as the pharmaceutical giant tests the upper bounds of its recent trading range. This move places the stock firmly in an uptrend, characterized by a steady SMA20 slope of 1.25% per 5 days, reflecting a consistent bid beneath the asset.
Trend and Price Structure
The stock’s positioning is fundamentally constructive. With the price now at 127.63 USD, Merck is trading comfortably above both its SMA20 (123.91 USD) and SMA50 (119.24 USD). In technical analysis, the distance between these averages serves as a measure of trend health; here, the widening gap suggests the primary trend remains decisively upward. The stock is currently occupying the upper half of its Bollinger Band structure, sitting at 70% of the %B indicator, which gauges where price sits relative to volatility bands.
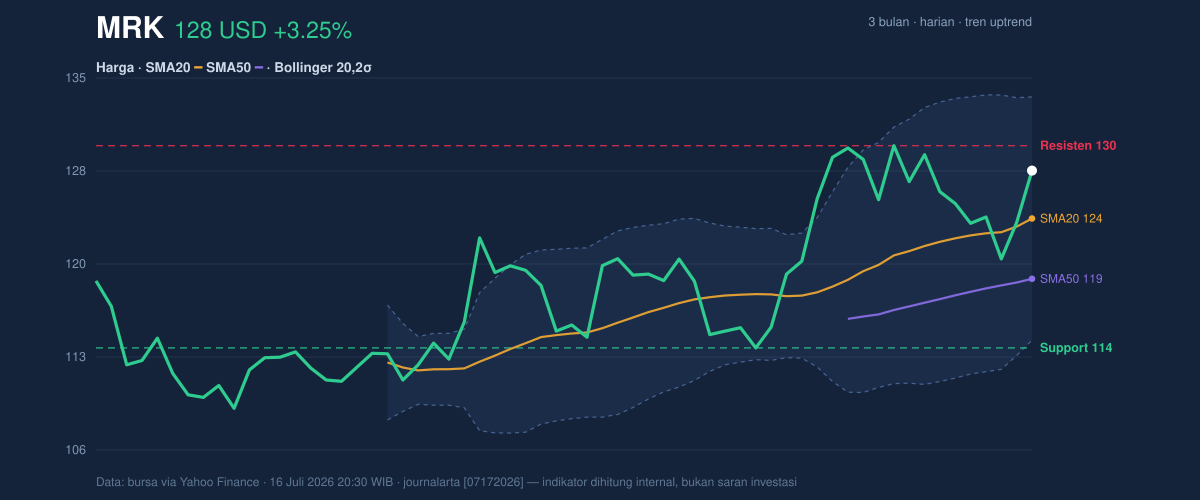
While the stock is currently trading at 88% of the range between its 20-day support of 113.87 USD and resistance at 129.56 USD, it is approaching the 3-month high of 130.29 USD. Crossing this threshold would effectively clear the path toward the Bollinger upper band of 133.35 USD.
Momentum and Flow
The momentum profile presents a nuanced picture. The RSI(14) at 57.9 resides in neutral territory, suggesting that while the stock is gaining ground, it is not yet "overbought" or showing signs of exhaustion. Conversely, the MACD reading of 1.647 sits below its signal line of 2.026, creating a negative histogram of -0.379.
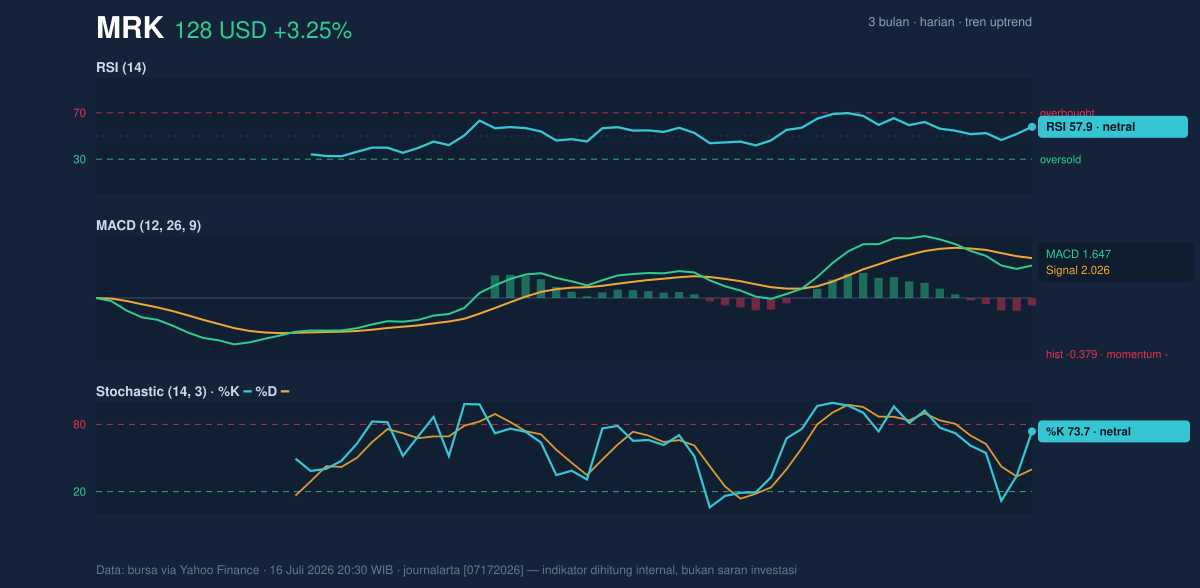
This divergence is critical: the price is rising, yet the MACD—a trend-following indicator—has not yet caught up to the intensity of the latest rally. However, the Stochastic %K at 73.7 is trending upward toward the %D, implying that the short-term internal momentum is shifting in favor of the bulls.
Volatility and Volume
Participation is a key pillar of this move. Trading volume hit 13,029,600 shares, roughly 1.2x the 20-day average. When price climbs on higher-than-average volume, it confirms that institutional capital is driving the move rather than thin, speculative interest. Furthermore, the OBV (On-Balance Volume) is rising, suggesting that money flow is accumulating within the security. With an ATR(14) of 3.66—or 2.9% of the price—volatility is currently categorized as moderate, meaning the stock has room to move without triggering extreme swings that would indicate instability.
Key Levels & Scenarios
Investors are currently focused on the resistance at 129.56 USD. If the stock sustains its current volume profile, a clean break above this level would likely shift the focus toward the Bollinger top band. Conversely, a failure to hold the SMA20 at 123.91 USD would force the stock back into the lower congestion zone, testing the resilience of the support at 113.87 USD.
Technical Verdict: HOLD (wait & see)
The technical outlook for Merck is balanced between a strong volume-backed uptrend and a lagging momentum signal. The "Hold" stance reflects the need to see if the price can decisively clear the 129.56 USD resistance level to confirm the next leg higher, or if the current negative MACD histogram triggers a temporary pullback to the mean.
* Entry Range: 123.91 USD – 125.00 USD (Re-test of SMA20)
* Target Price: 129.56 USD – 133.35 USD (Resistance/Bollinger Upper Band)
* Stop Loss: 119.24 USD (SMA50 support)
* Verdict invalidated if price falls below 119.24 USD
This verdict is invalidated if price breaks below the SMA50, which would signal a shift in the medium-term trend.
Merck is scheduled to release its next quarterly financial disclosures following the current period, which will provide the fundamental catalyst to either validate or reverse these technical signals.
Summary Data MRK
| Last price | 127.63 USD |
| Change 1 day / 5 days / 1 month | 3.25% / 2.05% / 10.82% |
| Trend / MA-cross | uptrend / none |
| SMA20 / SMA50 | 123.91 / 119.24 |
| RSI (14) / Stochastic %K | 57.9 / 73.7 |
| Bollinger %B / ATR | 70% / 3.66 |
| Support / Resistance 20 days | 113.87 / 129.56 |
| Data as of | 16 Juli 2026 20:30 WIB |



