CRM Testing Key Resistance: Stock Gains 3.40% (Juli 17, 2026)
On Juli 17, 2026: price 172.68 USD, trend sideways, RSI 56.1, support 150.12, resistance 172.68. technical analysis of crm stock. Key angle: CRM Testing Key…

Salesforce (CRM) shares surged on the New York Stock Exchange today, closing at 172.68 USD, a decisive gain of 3.40% that pushes the cloud computing giant to a critical technical juncture. Markets are reacting to a sustained upward drift, as the equity marks a 6.26% recovery over the past five sessions.
Momentum is building.
Trend and Price Action
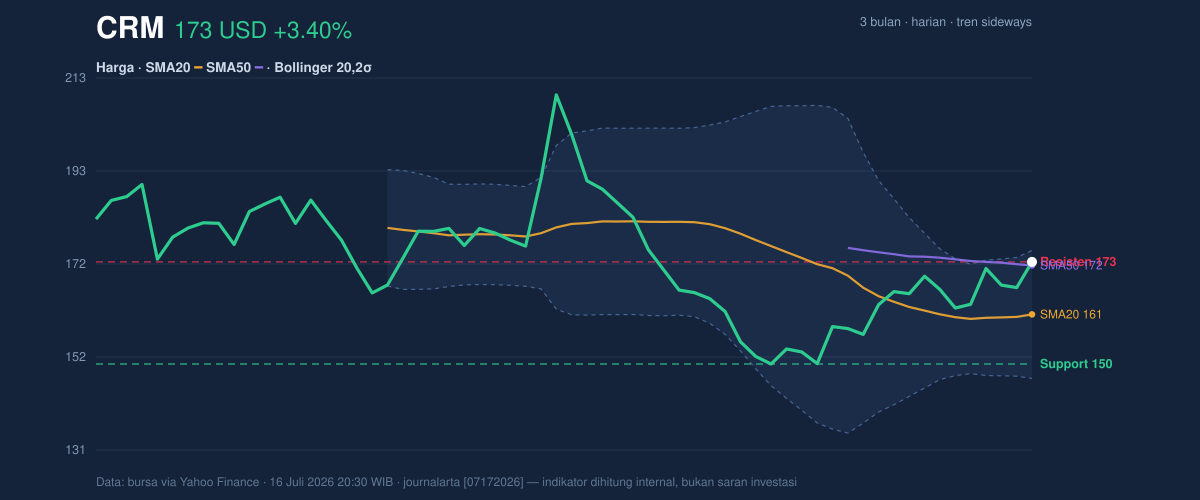
The stock is currently navigating a period of recovery within a broader sideways structure. By reclaiming the SMA50 at 171.92 USD and maintaining a position comfortably above the SMA20 at 161.08 USD, Salesforce has signaled a shift in short-term sentiment. The slope of the SMA20, rising at 0.38% per five days, suggests that the heavy selling pressure observed over the last three months—where the stock hit a low of 146.32 USD—is beginning to dissipate. As shown in the chart below, the price is testing the upper limits of its recent range.
Oscillators and Momentum
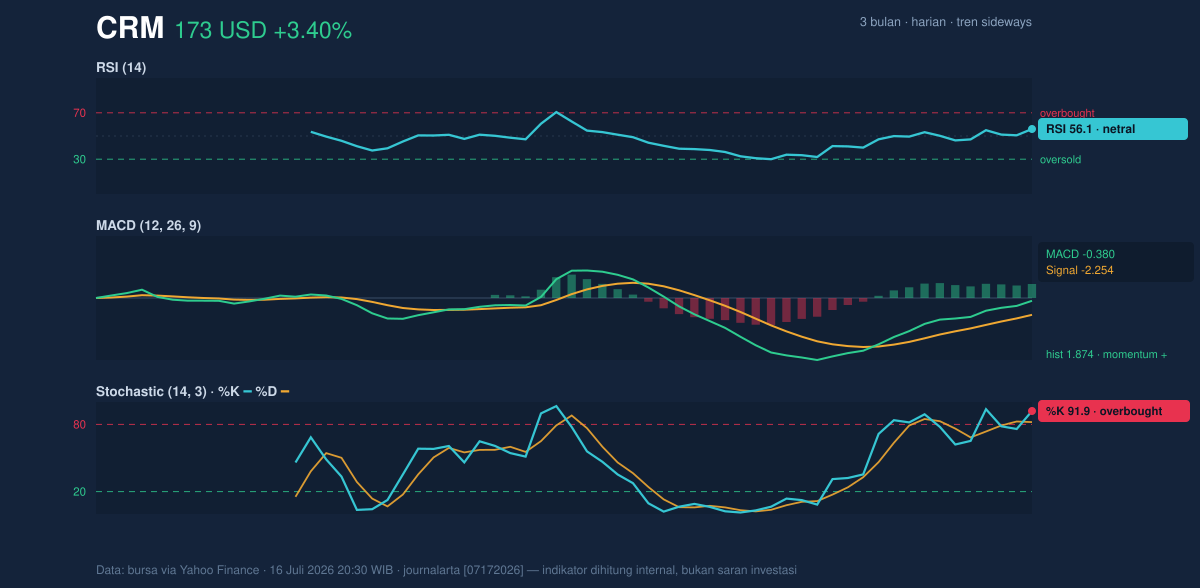
The technical picture provided by momentum indicators is mixed, suggesting a need for caution. While the MACD reading of -0.380 remains below the zero line, the fact that it is above its signal line (-2.254) with a growing positive histogram of 1.874 indicates that bullish energy is accumulating. However, the Stochastic oscillator at 91.9 (%K) and 82.0 (%D) flashes an overbought signal. When combined with an RSI of 56.1, which remains in neutral territory, it suggests that the recent price jump may be running ahead of the underlying buying velocity.
Volatility and Volume
A distinct divergence has appeared between price performance and market participation. Salesforce’s trading volume reached 12,051,300, which is only 0.7 times the 20-day average. Low volume during a price breakout often signals a lack of conviction among institutional investors. Furthermore, the OBV (On-Balance Volume) is trending downward, which contradicts the price rally and suggests that "smart money" may not be aggressively accumulating at these levels. With an ATR of 6.76, the stock is experiencing high volatility, meaning traders should anticipate wider price swings than the daily percentage move suggests.
Key Levels and Scenarios
Salesforce is currently testing the resistance level of 172.68 USD, which aligns perfectly with its daily closing price. Because the Bollinger %B is at 91%, the stock is approaching the upper band limit of 175.23 USD. If the stock manages to break and hold above this resistance, it could signal a trend reversal toward the 3-month high of 211.34 USD. Conversely, a failure to hold the 161.08 USD pivot point (the SMA20) could invite a retest of the lower support floor near 150.12 USD.
Technical Verdict: HOLD (wait & see)
The current technical setup for Salesforce reflects a "wait and see" environment. While the price action above the moving averages is constructive, the lack of volume support and overbought stochastic readings suggest that the current rally lacks the necessary foundation for an immediate breakout.
* Entry Range: 160.00 USD – 162.00 USD (on a pullback to the SMA20)
* Target Price: 175.23 USD (Bollinger Upper Band)
* Stop Loss: 150.12 USD (20-day support floor)
* Verdict invalidated if price falls below 146.32 USD, the 3-month structural low.
The technical evidence indicates that while the immediate trend is improving, current participation levels do not yet confirm a sustainable shift in the long-term price trajectory.
Salesforce ended the session with 12,051,300 shares traded, significantly below the 20-day average of 16,221,465.
Summary Data CRM
| Last price | 172.68 USD |
| Change 1 day / 5 days / 1 month | 3.40% / 6.26% / 6.78% |
| Trend / MA-cross | sideways / none |
| SMA20 / SMA50 | 161.08 / 171.92 |
| RSI (14) / Stochastic %K | 56.1 / 91.9 |
| Bollinger %B / ATR | 91% / 6.76 |
| Support / Resistance 20 days | 150.12 / 172.68 |
| Data as of | 16 Juli 2026 20:30 WIB |



