NKE Stock Analysis: Gains 4.21%, Testing Key Resistance
On Juli 17, 2026: price 44.57 USD, trend sideways, RSI 55.5, support 40.75, resistance 45.20. technical analysis of nke stock. Key angle: NKE Stock Analysis.

Nike Inc. (NKE) shares surged by 4.21% on the New York Stock Exchange as of July 16, 2026, closing at 44.57 USD. This sharp intraday move tests the upper limits of the stock’s recent range, drawing investors’ eyes toward a pivot point that has defined the equity’s struggle throughout the last quarter. While the broader market remains attentive to Nike’s operational pivots, the technical landscape suggests that the recent rally is navigating a thin margin of participation.
Trend and Price Action
The stock is currently trading at 44.57 USD, positioning it above the SMA20 (42.93 USD), though it remains tethered below the SMA50 (43.62 USD). This divergence signals a potential transition, yet the lack of a clear moving average cross leaves the primary trend in a sideways consolidation. The negative slope of the SMA20—downward at -0.78% over five days—reminds us that the weight of the longer-term downtrend remains a gravitational force for any upside breakout attempt.
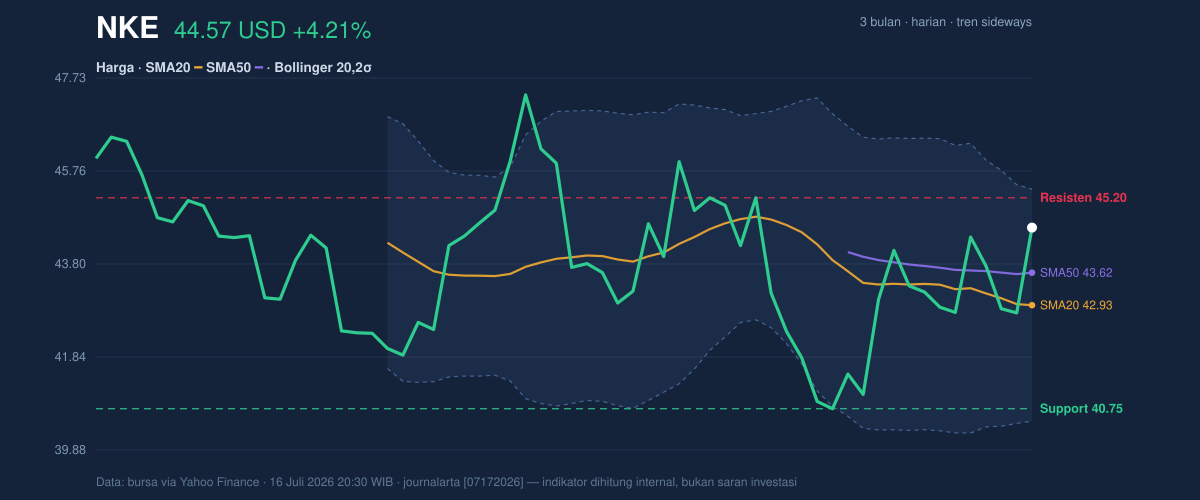
With the price currently situated at 86% of the range between the 20-day support of 40.75 USD and the 20-day resistance of 45.20 USD, the room for maneuver is narrowing. The Bollinger Band analysis confirms this, with the price pushing toward the upper band of 45.38 USD. A %B of 83% indicates the stock is reaching the upper extremes of its standard volatility expectations, often a precursor to a pause or a reversal in high-volatility environments.
Oscillators and Momentum
The momentum profile presents a mixed narrative. The MACD is at -0.060, sitting above its signal line of -0.245, with a positive histogram of 0.186. This suggests that while short-term momentum is shifting toward the bulls, the overall structure remains fragile.
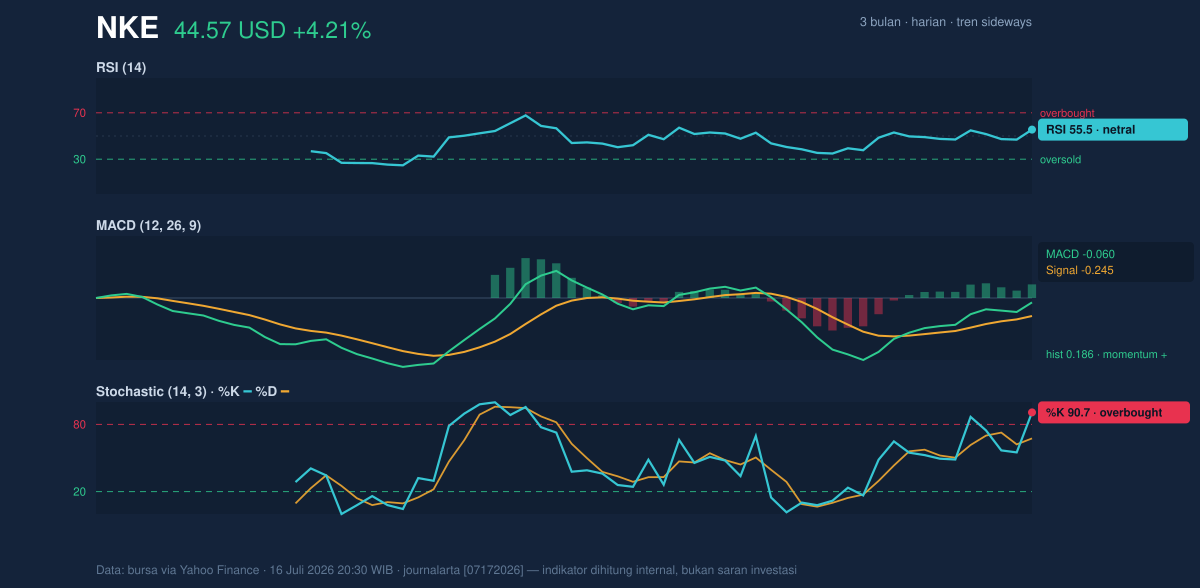
The real caution lies in the Stochastic %K at 90.7, which is firmly in overbought territory. When a stock reaches an overbought stochastic reading, it suggests that the rapid price ascent may have exhausted the immediate supply of buyers. Meanwhile, the RSI at 55.5 remains firmly neutral, providing little confirmation of a sustained breakout. This divergence between the aggressive Stochastic and the measured RSI hints that current buying pressure is localized rather than structural.
Volatility and Volume
Volume metrics reveal the most concerning detail for those looking for a reversal: the daily volume of 15,910,200 shares is merely 0.5x the 20-day average, indicating that the move is occurring on significantly light participation. Furthermore, the OBV (On-Balance Volume) is trending downward, suggesting that institutional capital is not yet rotating back into the stock in a meaningful way.
With an ATR of 1.57, the stock is exhibiting high volatility, representing roughly 3.5% of its share price. This level of instability means that even modest news flow could trigger rapid movements toward the 45.20 USD resistance or, conversely, back down toward the 40.75 USD support floor.
Technical Verdict: HOLD (wait & see)
The current setup reflects a stock attempting to break out of a low-volume doldrum without the necessary institutional volume to support a sustained rally. The combination of low-volume buying and overbought stochastic signals suggests that chasing the current price is a high-risk endeavor.
* Entry Range: Observe for a consolidation phase between 42.50 USD and 43.00 USD.
* Target Price: 45.20 USD (Initial resistance test).
* Stop Loss: Below 40.75 USD (Violation of 20-day support).
The verdict is invalidated if price breaks decisively above the 45.38 USD upper Bollinger band on a significant spike in trading volume.
The market is currently showing a lack of conviction, and until volume confirms the price action, caution is the prudent path for observers.
Summary Data NKE
| Last price | 44.57 USD |
| Change 1 day / 5 days / 1 month | 4.21% / 4.18% / -1.04% |
| Trend / MA-cross | sideways / none |
| SMA20 / SMA50 | 42.93 / 43.62 |
| RSI (14) / Stochastic %K | 55.5 / 90.7 |
| Bollinger %B / ATR | 83% / 1.57 |
| Support / Resistance 20 days | 40.75 / 45.20 |
| Data as of | 16 Juli 2026 20:30 WIB |



