Alibaba Stock Technicals Today: Gains 5.51%, Testing Key Resistance
On Juli 17, 2026: price 116.90 HKD, trend sideways, RSI 59.2, support 89.50, resistance 113.40. technical analysis of alibaba stock. Key angle: Alibaba Stock…

Alibaba Group (9988.HK) surged by 5.51% in the latest trading session to close at 116.90 HKD, a move that places the e-commerce giant firmly above its SMA50 of 116.51 HKD for the first time in recent weeks. This sudden upward shift, occurring against a backdrop of a largely sideways trend—evidenced by the marginal -0.22% slope of the 20-day simple moving average—signals a potential break from the persistent consolidation that has characterized the stock’s performance over the past quarter.
Trend and Price Action
The recent price action indicates a decisive attempt to reclaim the mid-to-upper territory of the stock's three-month range of 88.65 HKD to 144.00 HKD. By piercing the resistance level of 113.40 HKD, Alibaba has demonstrated an injection of buyer appetite, though the position relative to its Bollinger Bands suggests the move may be overextended. With the %B indicator at 103%, the stock is trading outside its upper Bollinger Band, which is a classic technical signal that the price has moved faster than the historical volatility—represented by the ATR of 5.52—can accommodate.
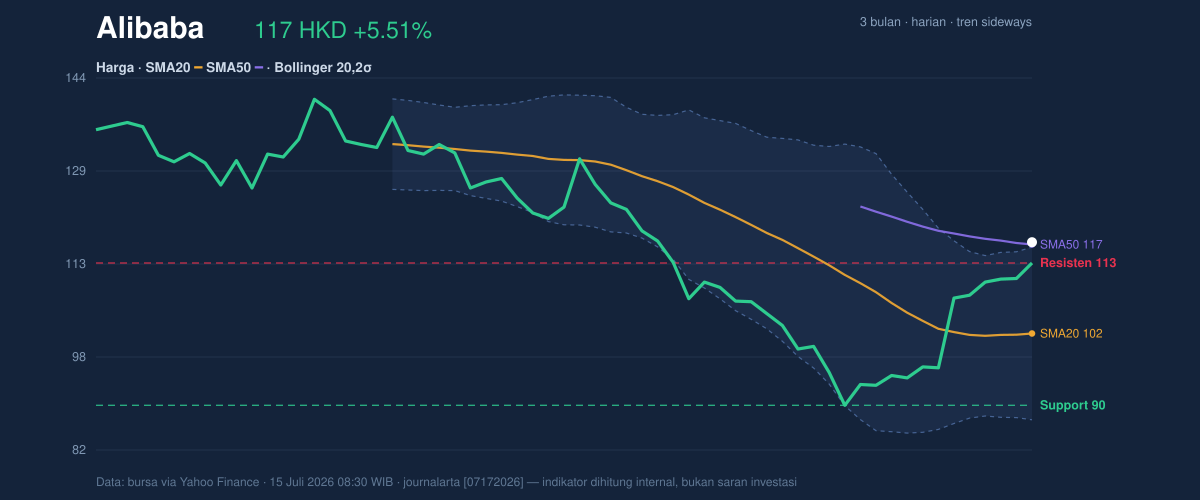
The expansion of the Bollinger Band width to 28.5% confirms that market participants are currently wrestling with heightened volatility, even as trading volume remains slightly below the 20-day average at 0.9x normal levels. While the OBV (On-Balance Volume) is trending upward, providing a degree of conviction to the move, the lack of a major spike in volume suggests this breakout is driven by a lack of selling interest rather than an overwhelming surge in institutional accumulation.
Oscillators and Momentum
Momentum indicators provide a mixed outlook, highlighting a tug-of-war between short-term greed and medium-term stabilization. The MACD is displaying positive momentum, with the signal line at -4.356 trailing the MACD line at -1.370, creating a growing histogram of 2.986. This divergence is constructive for bulls, suggesting that the underlying velocity of the stock is improving.
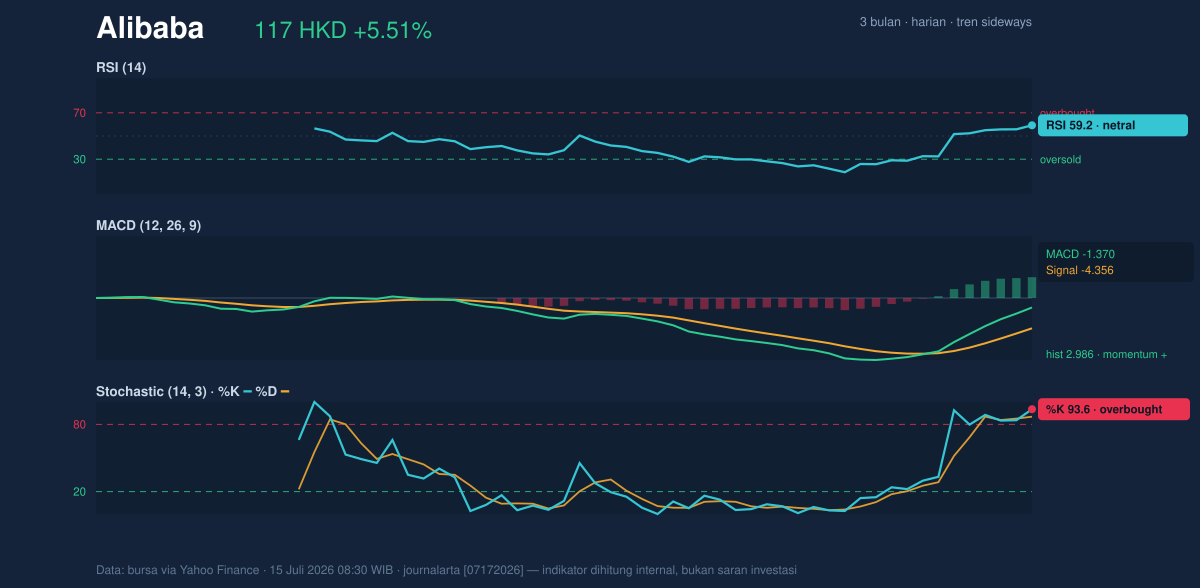
Conversely, the oscillators caution against immediate follow-through. The RSI at 59.2 remains neutral, leaving room for further upside before entering overbought territory. However, the Stochastic oscillator at 93.6 for %K and 86.9 for %D confirms that the stock is currently overbought on a short-term basis. When the Stochastic indicator enters this high zone while the price hits an upper Bollinger band, the statistical likelihood of a mean reversion—or at least a cooling-off period—increases significantly.
Key Levels and Scenarios
Alibaba now faces the task of defending its newfound position above the SMA50 of 116.51 HKD. If the stock fails to sustain this level, it risks a pullback toward the SMA20 of 101.57 HKD, which serves as a critical psychological and technical support line. Given the current volatility, a consolidation phase between 110.00 and 117.00 HKD would be seen as a healthy development to digest the 5.51% gain. Should the price sustain above the 116.90 HKD mark on rising volume, it would invalidate the current overbought signal and open the path for a test of higher resistance zones.
Technical Verdict: HOLD (wait & see)
* Reasons: The stock is technically overextended with a %B at 103% and Stochastic in overbought territory, suggesting that a short-term correction is likely before any sustainable move higher can occur. While the MACD positive momentum is encouraging, the lack of volume confirmation warrants patience.
* Invalidation: The HOLD verdict is invalidated if the price successfully consolidates above 117.00 HKD for three consecutive sessions, indicating the breakout has real momentum.
* Entry Range: 108.00 – 110.00 HKD (retest of support).
* Exit Target: 125.00 HKD (next significant overhead resistance).
* Stop Loss: 99.50 HKD (just below the SMA20).
The current price surge has hit a technical ceiling that suggests traders may prefer to pause and see if the stock can hold these gains before committing further capital.
The company's board has officially confirmed that the annual general meeting will be held on August 22, 2026.
Summary Data Alibaba
| Last price | 116.90 HKD |
| Change 1 day / 5 days / 1 month | 5.51% / 8.74% / 6.95% |
| Trend / MA-cross | sideways / none |
| SMA20 / SMA50 | 101.57 / 116.51 |
| RSI (14) / Stochastic %K | 59.2 / 93.6 |
| Bollinger %B / ATR | 103% / 5.52 |
| Support / Resistance 20 days | 89.50 / 113.40 |
| Data as of | 15 Juli 2026 08:30 WIB |


