Testing Key Resistance, Tencent Stock Gains 6.09% Today
On Juli 17, 2026: price 484.00 HKD, trend sideways, RSI 59.2, support 411.80, resistance 478.80. technical analysis of tencent stock. Key angle: Testing Key…

Tencent Holdings (0700.HK) surged on the Hong Kong Stock Exchange during Wednesday’s session, closing at 484.00 HKD, a sharp 6.09% gain that pushed the tech giant beyond its immediate resistance levels. This movement follows a period of consolidation, placing the stock in a precarious position as it tests the boundaries of its historical trading range while navigating a backdrop of fluctuating volatility.
Breaking the Ceiling
The price action represents a significant shift in the stock’s internal structure. By clearing the 478.80 HKD resistance level, Tencent has effectively snapped out of its sideways grind, where the SMA20 of 443.19 and SMA50 of 450.68 had previously acted as a tightening gravitational pull. Trading at 484.00 HKD, the stock is now positioned well above both major moving averages, suggesting that the recent bullish impulse has overcome the flat-to-neutral trend slope of 0.21%.
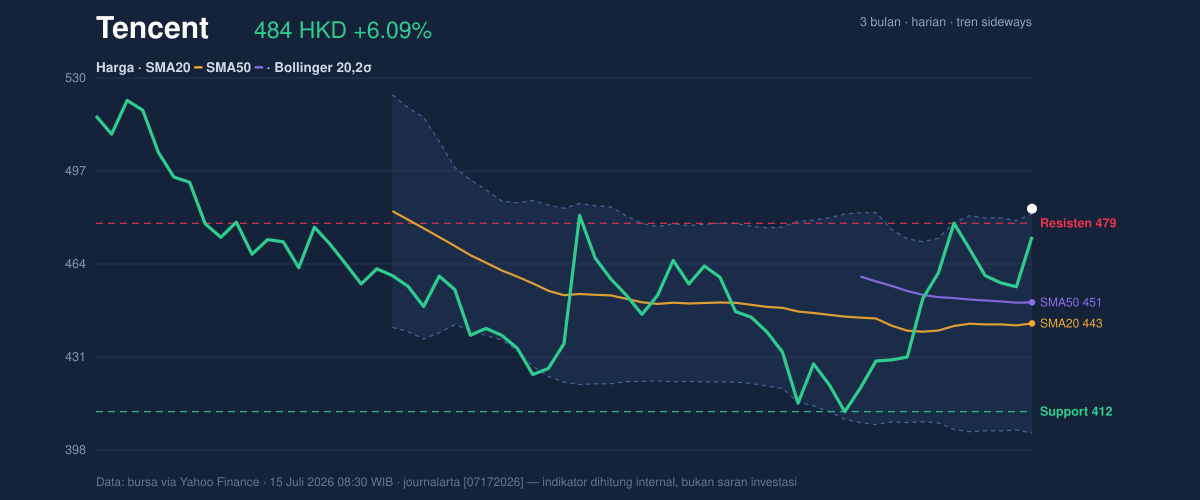
Crucially, the stock has pushed against the upper threshold of the Bollinger Band (20, 2σ), which sits at 482.21 HKD. With a %B of 102%, the price is technically outside the statistical "normal" expected range, a signal that often precedes a period of cooling or a "walking the bands" phenomenon where the trend remains aggressive despite the overextended state.
Momentum and Market Participation
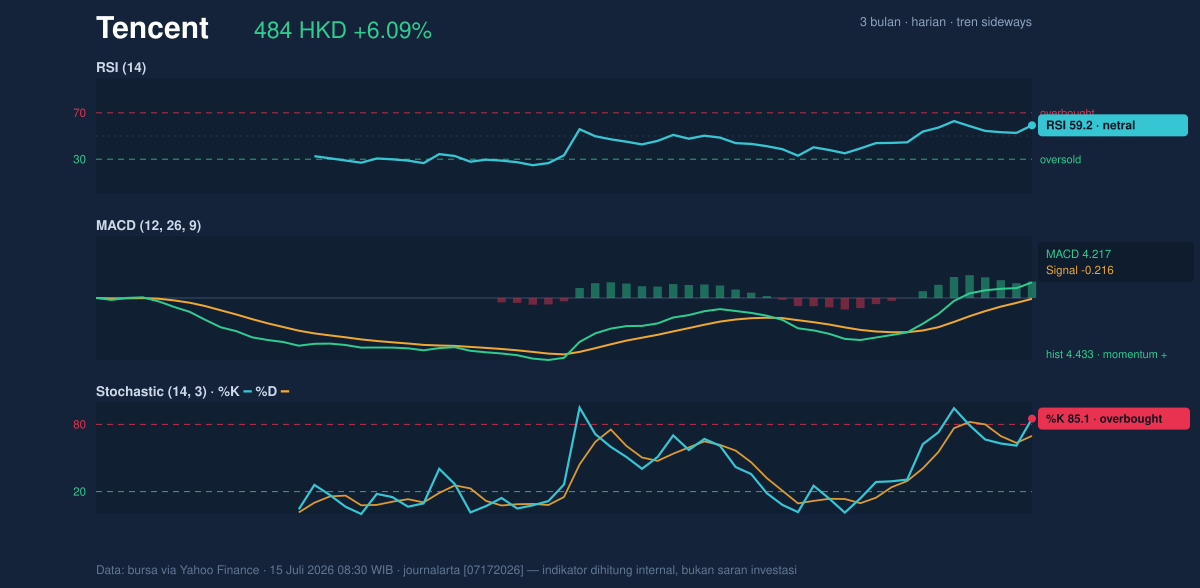
The internal engine driving this rally shows a clear divergence in intensity. The MACD at 4.217 and its positive histogram of 4.433 confirm that buying pressure is accelerating, providing a structural tailwind to the price move. However, this optimism is tempered by the Stochastic oscillator, which reads at %K 85.1, signaling overbought conditions. When combined with an RSI of 59.2, which remains in neutral territory, the market suggests that while the current momentum is undeniably positive, the speed of the ascent is likely to invite profit-taking.
The volume picture is equally telling. Trading at 33,780,856 shares, volume is currently tracking at 1.0x the 20-day average. Because this surge occurred on average volume rather than an explosive spike, the OBV (On-Balance Volume) trend remains steady, implying that the rally is being fueled by institutional participation rather than retail panic. However, an ATR(14) of 18.06—equating to roughly 3.7% of the share price—indicates that the stock is moving with high volatility. Traders should expect the price to swing by nearly 18 HKD on a typical day, widening the threshold for what constitutes a "normal" move.
Technical Verdict: HOLD (Wait & See)
The current technical state of Tencent is one of aggressive breakout followed by immediate overextension. The stock has cleared a major hurdle, but the collision with the upper Bollinger Band and the overbought Stochastic status suggests that the 484.00 HKD level is a "hot" zone where sustainability will be tested.
* Reasons for caution:
* Stochastic Overbought signal: Reaching 85.1 indicates the short-term rally is prone to a technical pullback.
* Bollinger Band expansion: The %B of 102% identifies the price as being at the edge of its statistical distribution.
* Verdict invalidated if: The price fails to hold the 478.80 HKD support level on a closing basis, signaling a "fake-out" move.
Suggested Parameters:
* Entry Range: 445.00 – 455.00 HKD (retest of support area)
* Exit Target: 526.50 HKD (3-month high)
* Stop Loss: 411.80 HKD (20-day support floor)
For the casual observer, this means the stock has successfully broken through its immediate glass ceiling, but the rapid speed of the climb necessitates a cautious approach until the price can prove it has found stable ground above its previous resistance.
*Disclaimer: This analysis is for educational purposes only and does not constitute financial or investment advice.*
Summary Data Tencent
| Last price | 484.00 HKD |
| Change 1 day / 5 days / 1 month | 6.09% / 1.09% / 5.31% |
| Trend / MA-cross | sideways / none |
| SMA20 / SMA50 | 443.19 / 450.68 |
| RSI (14) / Stochastic %K | 59.2 / 85.1 |
| Bollinger %B / ATR | 102% / 18.06 |
| Support / Resistance 20 days | 411.80 / 478.80 |
| Data as of | 15 Juli 2026 08:30 WIB |


