Singtel Stock Analysis: Drops 1.13%, Testing Support Level
On Juli 17, 2026: price 4.39 SGD, trend sideways, RSI 48.4, support 4.33, resistance 4.47. technical analysis of singtel stock. Key angle: Singtel Stock…

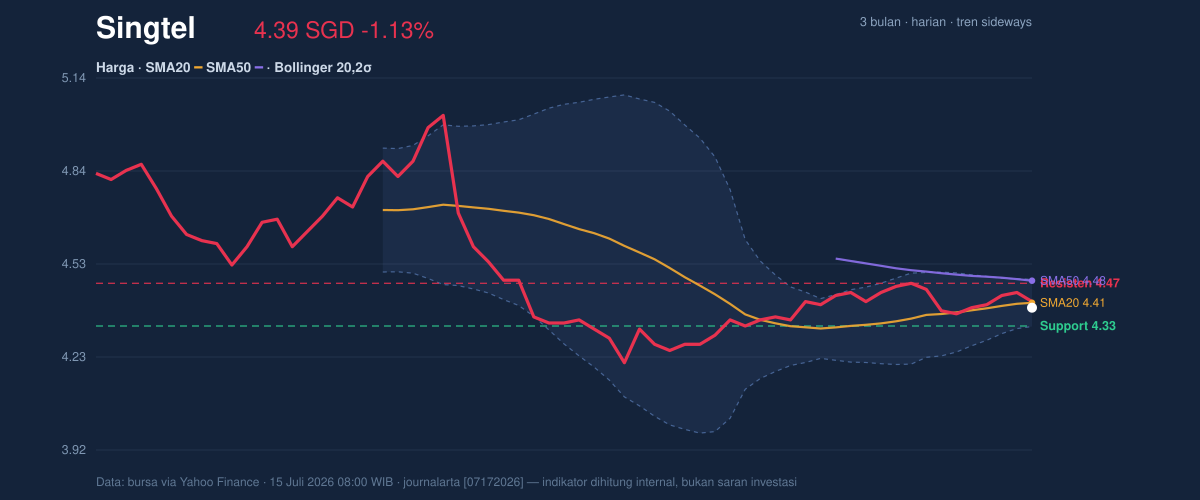
Singapore Telecommunications Limited (Z74.SI) saw its shares retreat on the Singapore Exchange (SGX) early this week, shedding 1.13% to settle at 4.39 SGD. This move places the telecommunications giant in a precarious position, as the share price currently sits just below the SMA20 of 4.41 SGD and the SMA50 of 4.48 SGD. While the broader trend remains characterized by a sideways drift—evidenced by a modest SMA20 slope of 0.72% over five days—the intersection of price and moving averages suggests the market is currently caught in a tug-of-war between recent consolidation and long-term overhead resistance.
Trend & Price Action
The technical structure of Singtel reflects a stock searching for direction within a established range. Trading at 4.39 SGD, the security is positioned at approximately 43% of its 20-day range, sandwiched between a firm support level of 4.33 SGD and a stiff resistance level of 4.47 SGD. The fact that the stock is currently trading below both its 20-day and 50-day simple moving averages (SMAs) indicates that sellers are currently dictating the immediate near-term narrative, preventing any significant bullish breakout from the current consolidation zone.
Volatility & Volume Dynamics
Market participation has noticeably intensified, with volume reaching 31,435,500 shares—roughly 1.2 times the 20-day average. This uptick in volume, coupled with a rising On-Balance Volume (OBV), suggests that despite the daily price dip, institutional interest is accumulation-biased rather than distribution-heavy. Furthermore, the Bollinger Bands show a squeeze condition with a width of just 3.5%. In technical parlance, this narrow band signifies a period of low volatility often preceding a significant expansion; with the %B at 40%, the price is effectively hovering near the midline, waiting for a catalyst to break either the upper 4.48 SGD band or the lower 4.33 SGD floor.
Oscillators & Momentum
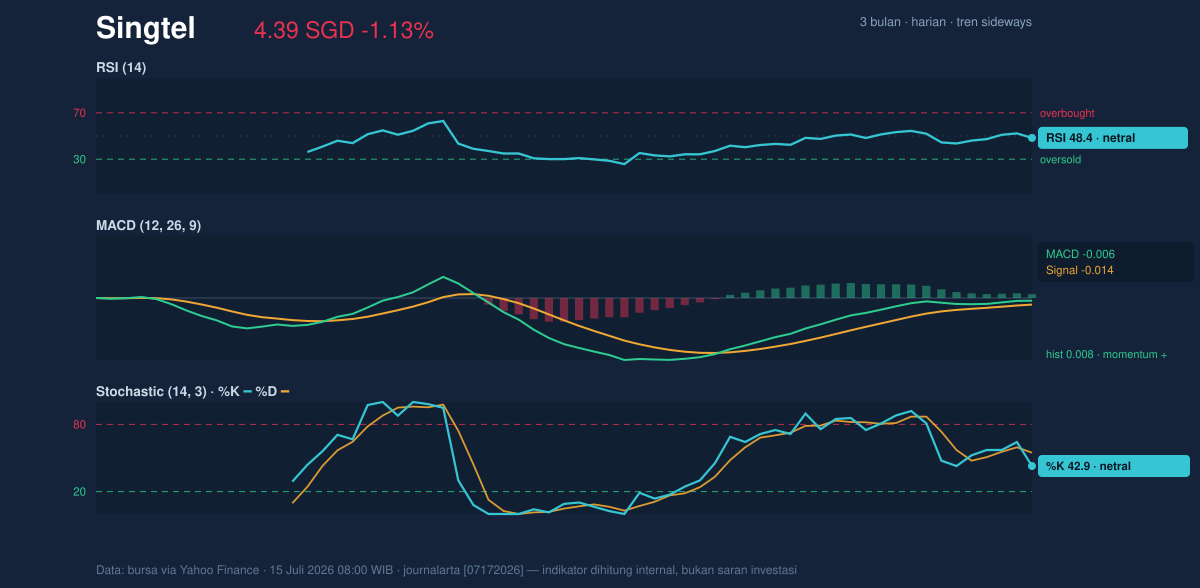
Momentum indicators provide a nuanced picture of the current state of play. The RSI(14) at 48.4 remains resolutely neutral, neither confirming a drift into oversold territory nor signaling a run toward overbought levels. Similarly, the Stochastic Oscillator (%K 42.9 / %D 54.8) sits in neutral ground. However, a glimmer of underlying strength persists in the MACD, which sits at -0.006 above its signal line of -0.014, producing a positive histogram reading of 0.008. This divergence indicates that while the price action is stagnant, the internal momentum is attempting to grind higher.
Technical Verdict: HOLD (wait & see)
The current technical setup suggests that the stock is in a state of high-compression equilibrium, making a directional bet premature until the Bollinger squeeze resolves.
* Rationale: The stock is caught between the 4.33 SGD support and 4.47 SGD resistance, with neutral RSI/Stochastic signals failing to confirm a breakout.
* Verdict Invalidation: The outlook shifts significantly if the price closes decisively below 4.33 SGD, potentially opening a test of lower range boundaries.
* Entry Range: 4.33 SGD – 4.35 SGD (on consolidation)
* Target Price: 4.47 SGD – 4.48 SGD (to test SMA resistance/Bollinger upper band)
* Stop Loss: 4.28 SGD (to protect against a breakdown of recent support)
Traders are likely waiting for the Bollinger Band squeeze to trigger a confirmed move above 4.48 SGD or a break below the 4.33 SGD support floor before committing capital. The company’s next significant corporate update remains the primary driver for volume beyond current technical ranges.
Summary Data Singtel
| Last price | 4.39 SGD |
| Change 1 day / 5 days / 1 month | -1.13% / 0.46% / 0.92% |
| Trend / MA-cross | sideways / none |
| SMA20 / SMA50 | 4.41 / 4.48 |
| RSI (14) / Stochastic %K | 48.4 / 42.9 |
| Bollinger %B / ATR | 40% / 0.07 |
| Support / Resistance 20 days | 4.33 / 4.47 |
| Data as of | 15 Juli 2026 08:00 WIB |



