AIA Stock Analysis: Gains 2.70%, Testing Key Resistance
On Juli 17, 2026: price 76.10 HKD, trend sideways, RSI 54.8, support 70.80, resistance 76.20. technical analysis of aia stock. Key angle: AIA Stock Analysis.

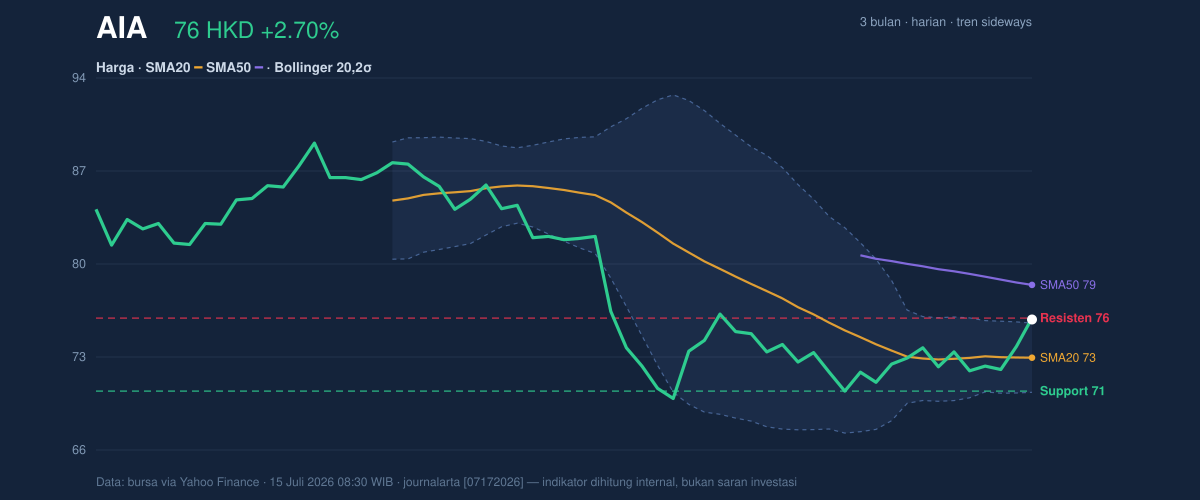
AIA Group (1299.HK) vaulted 2.70% in the latest session to settle at 76.10 HKD, signaling a sharp recalibration of investor sentiment as the insurance giant tests the upper boundary of its recent trading range. This move follows a period of consolidation, pushing the stock price above its SMA20 of 73.27 HKD, though it still faces a substantial hurdle as it remains below the SMA50 of 78.65 HKD. While the broader monthly trend reflects a marginal decline of 0.52%, the recent surge suggests a shift toward short-term bullishness, bolstered by trading volumes that hit 37.89 million shares—roughly 1.3 times the 20-day average.
Trend & Price Action
The price structure remains locked in a sideways trajectory, but the recent push has brought the stock into a critical junction. The price is now sitting at the 98% range of its 20-day support/resistance band, effectively challenging the resistance level of 76.20 HKD. Because the price has crossed above the upper Bollinger Band (75.83 HKD), the %B indicator at 105% indicates the asset is technically extended beyond its statistically expected range. The Bollinger band width at 7.0% suggests a significant squeeze, hinting that this breakout move could be the catalyst for a broader expansion in volatility.
Oscillators & Momentum
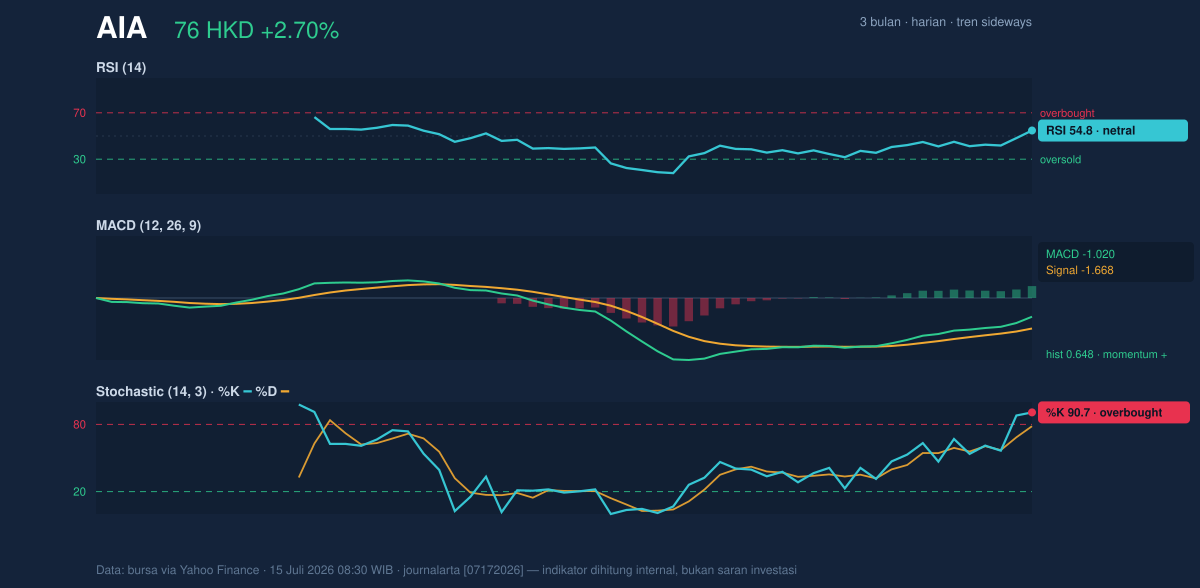
Momentum dynamics are providing a mixed signal that warrants caution. The RSI at 54.8 sits firmly in neutral territory, suggesting that despite the daily gain, the stock is not yet over-extended on a medium-term basis. Conversely, the Stochastic oscillator at 90.7 (%K) / 78.4 (%D) is deep within overbought territory, indicating that the immediate buying pressure may be approaching a point of exhaustion. However, the MACD of -1.020 remains in a constructive phase relative to its signal line (-1.668), with a positive histogram of 0.648 confirming that the underlying momentum is currently tilted to the upside.
Volatility & Volume
The surge in volume accompanying the price rise serves as a strong confirmation of participation, with the OBV (On-Balance Volume) trending upward, suggesting that institutional accumulation is supporting the move. With an ATR of 2.16, the stock is exhibiting moderate volatility—representing approximately 2.8% of its current share price. This level of movement is consistent with a market trying to break out of a multi-month range bound by the 3-month high of 89.95 HKD and a low of 69.05 HKD.
Technical Verdict: HOLD (wait & see)
The current technical posture suggests that AIA is at a pivotal inflection point where a breakout above immediate resistance is not yet guaranteed.
* Rationale: The stock is pushing against immediate resistance at 76.20 HKD while displaying overbought Stochastic conditions, suggesting a high probability of a short-term pullback or "re-test" of the breakout level.
* Invalidation: This wait-and-see posture is invalidated if the price decisively closes above 76.20 HKD on sustained high volume, which would signal a shift toward the SMA50 level.
* Entry Range: 73.00 – 74.00 HKD (targeting the SMA20 mean).
* Exit Target: 78.60 HKD (aligning with SMA50 resistance).
* Stop Loss: 70.70 HKD (aligning with the lower Bollinger Band support).
The market appears to be waiting for a clear signal to determine whether the stock can sustain this move above its current resistance, or if it will regress toward its moving average mean.
The company is scheduled to provide further transparency regarding its capital allocation strategy at the next semi-annual disclosure meeting.
Summary Data AIA
| Last price | 76.10 HKD |
| Change 1 day / 5 days / 1 month | 2.70% / 3.26% / -0.52% |
| Trend / MA-cross | sideways / none |
| SMA20 / SMA50 | 73.27 / 78.65 |
| RSI (14) / Stochastic %K | 54.8 / 90.7 |
| Bollinger %B / ATR | 105% / 2.16 |
| Support / Resistance 20 days | 70.80 / 76.20 |
| Data as of | 15 Juli 2026 08:30 WIB |


