HSBC Testing Key Resistance: Stock Gains 2.82% (Juli 17, 2026)
On Juli 17, 2026: price 156.90 HKD, trend uptrend, RSI 67.4, support 146.00, resistance 155.30. technical analysis of hsbc stock. Key angle: HSBC Testing Key…

HSBC Holdings (0005.HK) surged to 156.90 HKD during the latest session, a 2.82% leap that pushed the lender past its immediate resistance barrier. This move effectively clears the path for a re-evaluation of its 3-month peak, reflecting a robust influx of capital as market participants digest the bank's current trajectory. The surge is not merely a reflexive bounce; it represents a decisive push into new territory that challenges historical ceilings established over the preceding quarter.
Trend and Price Action
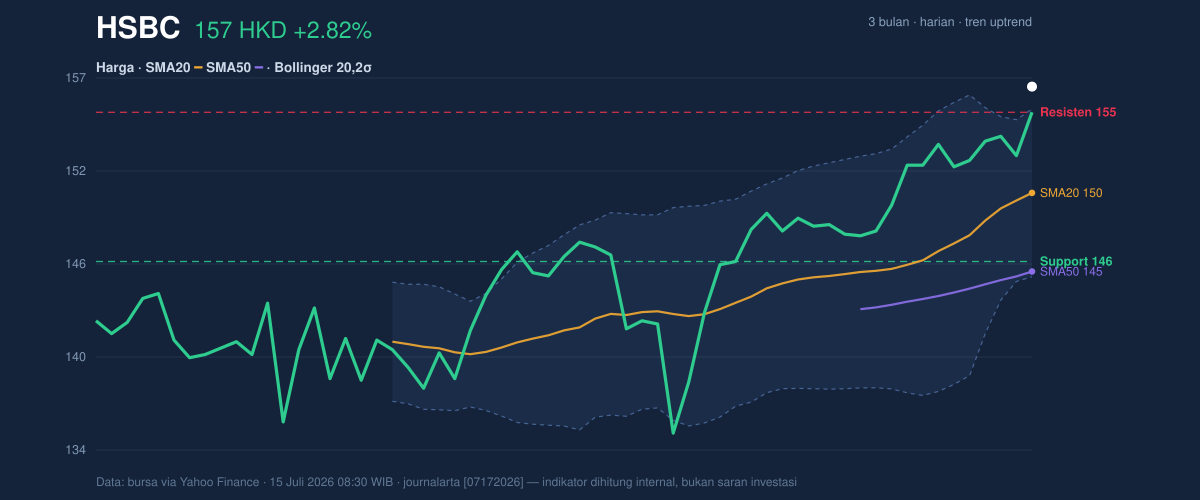
The stock is currently exhibiting a textbook uptrend, characterized by a slope of 2.14% in its 20-day Simple Moving Average (SMA20) over the last five days. With the price sitting comfortably at 156.90 HKD—well above both the SMA20 (150.28 HKD) and the SMA50 (145.37 HKD)—the structural integrity of the rally remains intact. Notably, the price has breached the upper Bollinger Band of 155.50 HKD, pushing the %B indicator to 113%. This expansion, coupled with the narrowing of the Bollinger bands (7.0% width), suggests a volatility-driven breakout rather than a random fluctuation.
Oscillators and Momentum
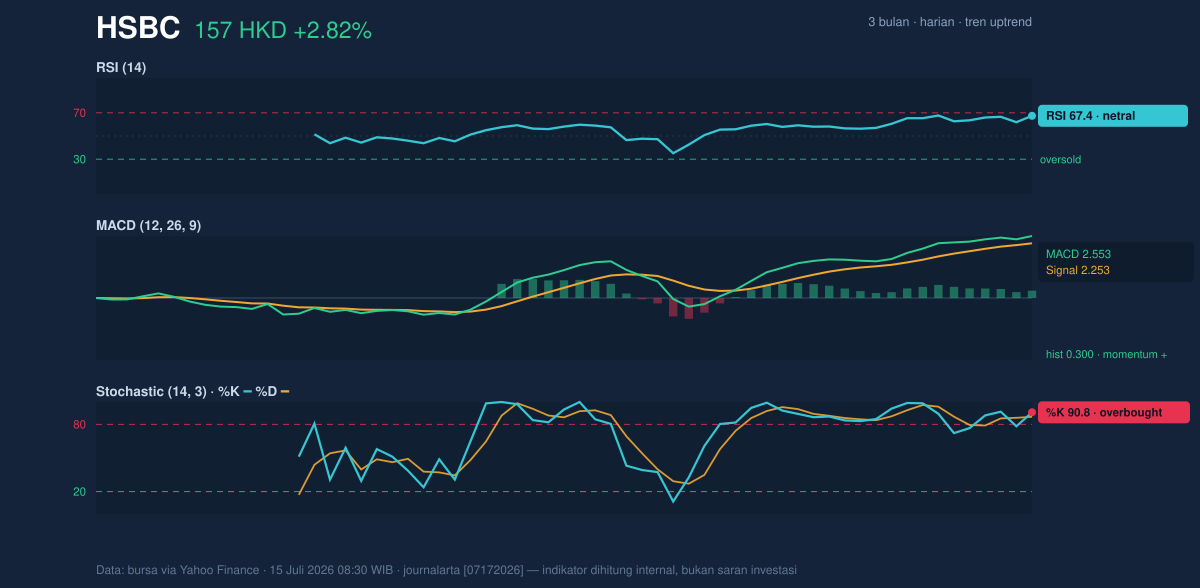
The momentum behind this move is underpinned by a widening MACD signal, where the MACD line at 2.553 sits above the signal line at 2.253, producing a positive histogram of 0.300. This confirms that the internal velocity of the price move is gathering strength. However, caution is warranted by the Stochastic oscillator, which registers at 90.8 (%K) and 86.8 (%D), placing the asset firmly in overbought territory. Meanwhile, the RSI at 67.4 remains in neutral-to-bullish waters, signaling that while the asset is stretched, it has not yet reached the extremes of a manic top.
Volatility and Volume
Participation is a vital component of this rally, with volume reaching 15,259,993—approximately 1.1 times the 20-day average. The upward trajectory of the On-Balance Volume (OBV) indicator provides a crucial confirmation: buyers are entering at these elevated levels rather than waiting for a pullback. The Average True Range (ATR) of 2.57 suggests that while the stock is moving, the volatility remains moderate, keeping the price action within a manageable range for current momentum traders.
Key Levels and Scenarios
The stock has successfully cleared the 20-day resistance of 155.30 HKD. Should the price hold above this level, it transitions into a new support zone. Conversely, if momentum falters and the price reverts to within the Bollinger bands, the 150.28 HKD level (the SMA20/Bollinger mean) will become the primary focus for market stability. A failure to hold the 146.00 HKD support level would invalidate the current bullish structure, signaling a potential shift in the trend.
Technical Verdict: HOLD (wait & see)
This verdict is based on the current divergence between strong price momentum and overextended oscillator signals.
* The stock exhibits a strong upward trend with volume confirmation (OBV).
* The Stochastic oscillator at 90.8 indicates a high likelihood of a near-term consolidation or minor pullback.
* Verdict invalidated if the price decisively closes below the 146.00 HKD support level.
Ideal Trading Parameters:
* Entry Range: 152.00 – 154.00 HKD (on a consolidation pullback).
* Exit Target: 160.00 HKD (next psychological extension).
* Stop Loss: 145.50 HKD (below key support/SMA50).
For the non-trader, this reflects a stock that has grown rapidly and may need a brief period of quiet trading before deciding on its next major move.
156.90 HKD
Summary Data HSBC
| Last price | 156.90 HKD |
| Change 1 day / 5 days / 1 month | 2.82% / 3.29% / 7.61% |
| Trend / MA-cross | uptrend / none |
| SMA20 / SMA50 | 150.28 / 145.37 |
| RSI (14) / Stochastic %K | 67.4 / 90.8 |
| Bollinger %B / ATR | 113% / 2.57 |
| Support / Resistance 20 days | 146.00 / 155.30 |
| Data as of | 15 Juli 2026 08:30 WIB |



