BP Stock Technicals Today: Drops 1.22%, Testing Key Resistance
On Juli 17, 2026: price 510.20 GBp, trend sideways, RSI 54.1, support 455.60, resistance 516.50. technical analysis of bp stock. Key angle: BP Stock Technicals.

BP plc is navigating a precarious transition zone. Trading at 510.20 GBp, the energy giant is currently testing the structural integrity of its recent recovery, sitting uncomfortably close to a confluence of technical barriers. As global energy markets weigh supply constraints against shifting macro-economic outlooks, BP’s price action reveals a tug-of-war between a constructive momentum shift and a fatigue-prone ceiling.
Trend and Price Architecture
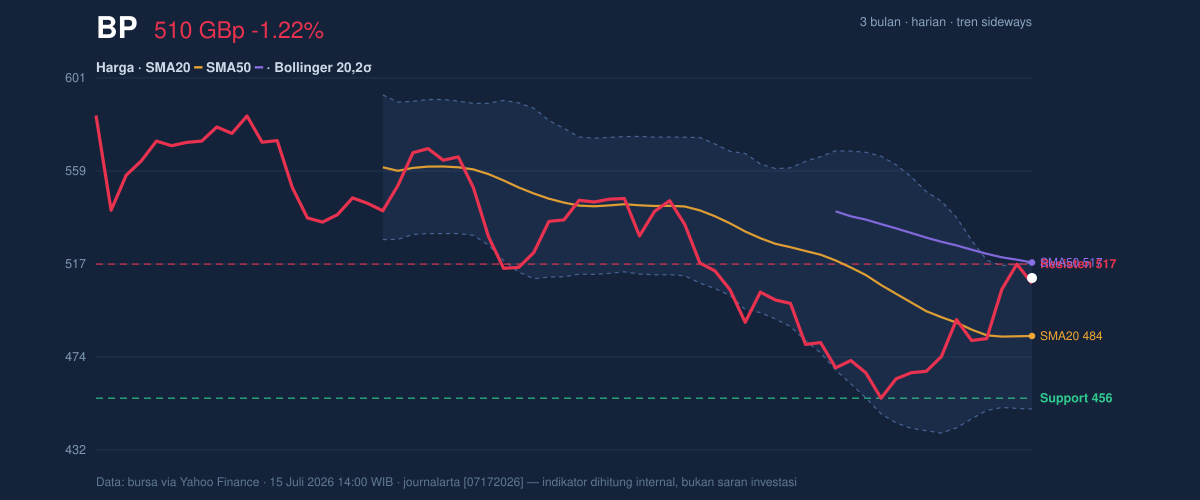
The stock is in a state of flux. While it rests comfortably above its SMA20 of 483.86 GBp, the recent cooling—a 1.22% retreat from the previous close—highlights the pressure inherent in the 517.21 GBp resistance level, defined by the SMA50. Price is currently trapped in a tight corridor, oscillating within the upper reaches of the Bollinger Bands. With the %B sitting at 90%, the stock is pressing against the upper boundary of 517.04 GBp, suggesting that the current rally is stretched and nearing a point of exhaustion.
Momentum and Oscillators
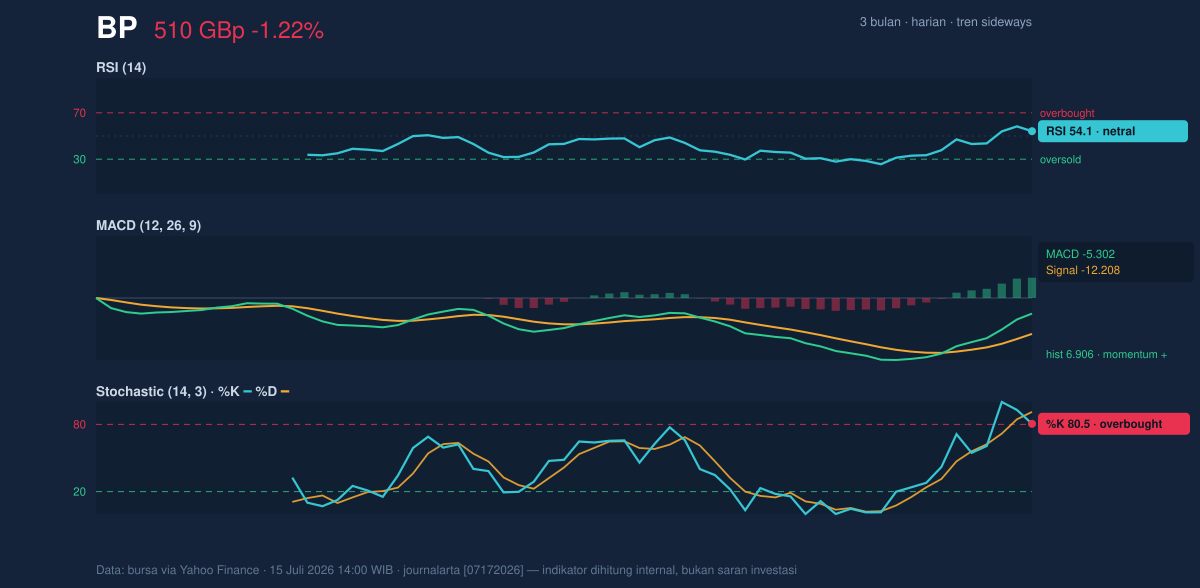
The divergence between oscillators is telling. While the MACD reading of -5.302 against a signal line of -12.208 provides a positive momentum histogram of 6.906, the rapid oscillators suggest a potential trap. The Stochastic %K at 80.5, crossing below the %D at 91.2, is a textbook signal of overbought conditions. This implies that the recent 3.85% gain over the last five days may have outpaced fundamental support, leaving the stock vulnerable to a snap-back towards its mean.
Volatility and Volume Dynamics
Market participation appears lackluster. Despite the upward trend in the On-Balance Volume (OBV), which suggests that institutional accumulation is not entirely absent, the actual trading volume is muted at 23.6 million shares—just 0.6x the 20-day average. Low-volume moves in either direction are inherently suspect, as they lack the conviction of a broad-based market push. With an ATR of 11.88, daily price swings remain contained, reinforcing the current sideways structure rather than an explosive breakout.
Key Levels and Scenarios
The battleground is clearly defined between 455.60 GBp (support) and 516.50 GBp (resistance). A decisive close above the SMA50 (517.21 GBp) would technically invalidate the current bearish divergence in the Stochastic, potentially opening a path toward the 3-month highs near 592.00 GBp. Conversely, should the price fail to maintain the 483.86 GBp pivot, a test of the lower Bollinger Band at 450.69 GBp becomes the primary downside objective.
Technical Verdict: HOLD (wait & see)
* Rationale 1: The stock is trading at 90% of its Bollinger Band range, signaling the price is over-extended and lacks the volume to push through the immediate 517.21 GBp overhead resistance.
* Rationale 2: The Stochastic indicator is in overbought territory, warning of a near-term correction despite the positive MACD momentum.
* Invalidation: The verdict is invalidated if price breaks with high volume above 520.00 GBp, which would negate the overbought signal and shift the trend to bullish.
Ideal Parameters:
* Entry Range: 480.00 – 485.00 GBp (awaiting a pullback to the mean)
* Exit Target: 516.50 GBp
* Stop Loss: 450.00 GBp
The current technical setup suggests that investors are hesitant to commit capital at these levels until the stock proves it can sustainably clear its moving average resistance.
BP’s next major pivot will likely be dictated by the upcoming quarterly earnings calendar and any shifts in sector-wide volatility.
Summary Data BP
| Last price | 510.20 GBp |
| Change 1 day / 5 days / 1 month | -1.22% / 3.85% / 1.07% |
| Trend / MA-cross | sideways / none |
| SMA20 / SMA50 | 483.86 / 517.21 |
| RSI (14) / Stochastic %K | 54.1 / 80.5 |
| Bollinger %B / ATR | 90% / 11.88 |
| Support / Resistance 20 days | 455.60 / 516.50 |
| Data as of | 15 Juli 2026 14:00 WIB |



