Shell Stock Analysis: Gains 0.41%, Testing Key Resistance
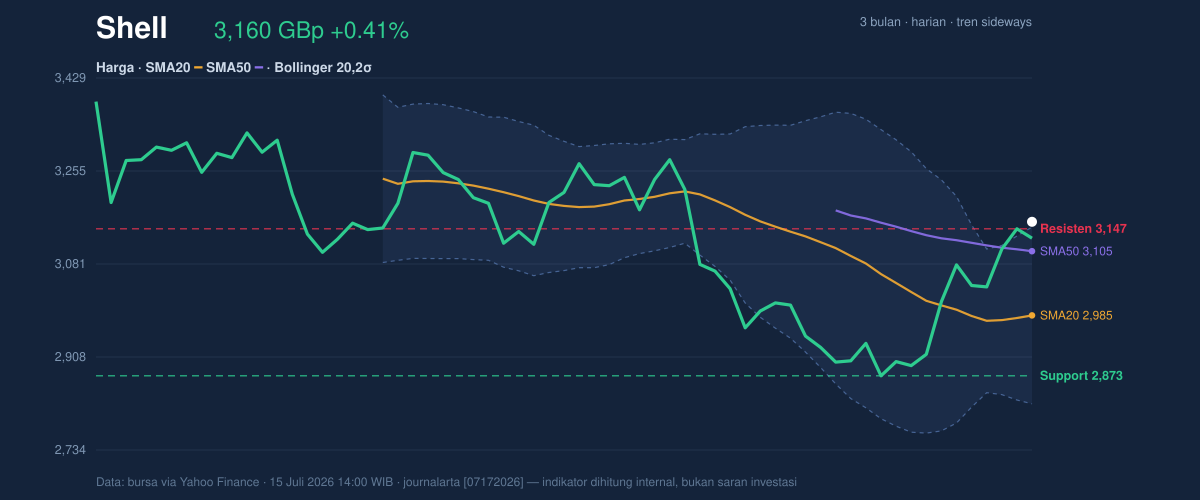
On Juli 17, 2026: price 3,160.00 GBp, trend sideways, RSI 57.7, support 2,872.50, resistance 3,147.00. technical analysis of shell stock.

Shell plc (SHEL.L) shares edged higher to 3,160.00 GBp on the London Stock Exchange, marking a modest 0.41% daily gain as the energy major navigates a cooling trend within a broader consolidation phase. While the stock has climbed 4.12% over the past month, the underlying technical structure suggests a struggle between current bullish momentum and the constraints of established price ranges. Market participants are observing a narrowing gap between the stock’s current position and its structural ceilings, where volume participation remains muted—registering at just 0.7 times its 20-day average.
Trend & Price Action
The price currently sits at 3,160.00 GBp, positioning it comfortably above both the SMA20 (2,985.15 GBp) and SMA50 (3,105.07 GBp). This hierarchy confirms a constructive intermediate-term bias, yet the SMA20’s recent trajectory—a slope of -0.36% over five days—highlights a loss of directional conviction. Shell is currently trading at 103% of its Bollinger Band width, a signal that price is testing the upper extremity of its calculated volatility range. This breach of the upper band (3,150.15 GBp) indicates a short-term "stretch" that often precedes either a breakout or a mean-reversion pull-back.
Oscillators & Momentum
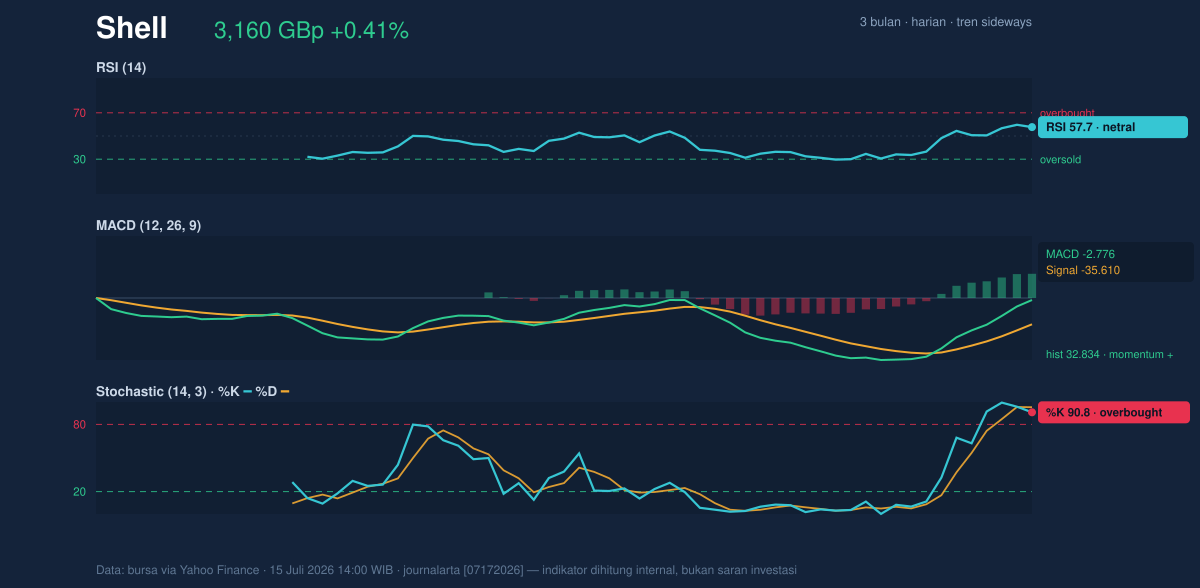
Momentum indicators provide a conflicting narrative for market participants. The MACD reflects positive momentum, with the MACD line at -2.776 sitting above the signal line of -35.610, further supported by a positive histogram of 32.834. Conversely, the Stochastic oscillator is signaling overbought conditions, with %K at 90.8 and %D at 95.4. While the RSI (14) remains in neutral territory at 57.7, the disconnect between the MACD’s underlying strength and the Stochastic’s exhaustion suggests that the current resistance level of 3,147.00 GBp is acting as a significant psychological hurdle. Without a spike in volume to confirm this move, the current ascent appears fragile.
Volatility & Volume
Volatility, measured by the ATR(14) at 128.88, represents approximately 4.1% of the share price, confirming that Shell remains subject to high-amplitude swings despite the recent sideways drift. The On-Balance Volume (OBV) trend is rising, which suggests that institutional interest is accumulating rather than distributing, even if daily turnover remains below average. The lack of volume accompanying this rise toward the 3,147.00 GBp resistance is a classic sign of buyer fatigue, implying that the market is waiting for a catalyst to justify a sustained move toward higher ground or a deeper retracement toward the 2,872.50 GBp support.
Technical Verdict: HOLD
The current technical configuration for Shell suggests a period of caution rather than aggressive positioning. The proximity to the upper Bollinger Band coupled with overbought Stochastic readings advises against chasing the price at these levels.
* Hold (Wait & See): Current indicators suggest the price is overextended in the short term, requiring a consolidation or a clean break of resistance to establish a new trend.
* Invalidation: The technical outlook turns significantly bearish if the price falls below the 2,985.15 GBp level (SMA20/Bollinger Mean), which would negate the current support structure.
* Range Parameters:
* Entry Range: 2,985.00 – 3,050.00 GBp
* Target Price (Resistance): 3,147.00 GBp (initial)
* Stop Loss Protection: 2,870.00 GBp
For those observing the market, this represents a classic "wait and see" scenario where the stock must either cool its heels through time or break decisively through current resistance to gain further momentum.
*Disclaimer: This analysis is for informational purposes only and does not constitute financial advice or investment recommendations. Market data is provided for analytical reference; please consult with a qualified financial advisor before making any financial decisions.*
The underlying data confirms that as of July 15, 2026, Shell is navigating a high-volatility environment where the immediate priority for the market is testing whether the 3,147.00 GBp mark holds as a foundation or remains a hard ceiling.
Summary Data Shell
| Last price | 3,160.00 GBp |
| Change 1 day / 5 days / 1 month | 0.41% / 2.61% / 4.12% |
| Trend / MA-cross | sideways / none |
| SMA20 / SMA50 | 2,985.15 / 3,105.07 |
| RSI (14) / Stochastic %K | 57.7 / 90.8 |
| Bollinger %B / ATR | 103% / 128.88 |
| Support / Resistance 20 days | 2,872.50 / 3,147.00 |
| Data as of | 15 Juli 2026 14:00 WIB |



