AstraZeneca Momentum Weakens: Stock Gains 2.14% (Juli 17, 2026)
On Juli 17, 2026: price 12,628.00 GBp, trend sideways, RSI 35.6, support 12,364.00, resistance 14,538.00. technical analysis of astrazeneca stock.

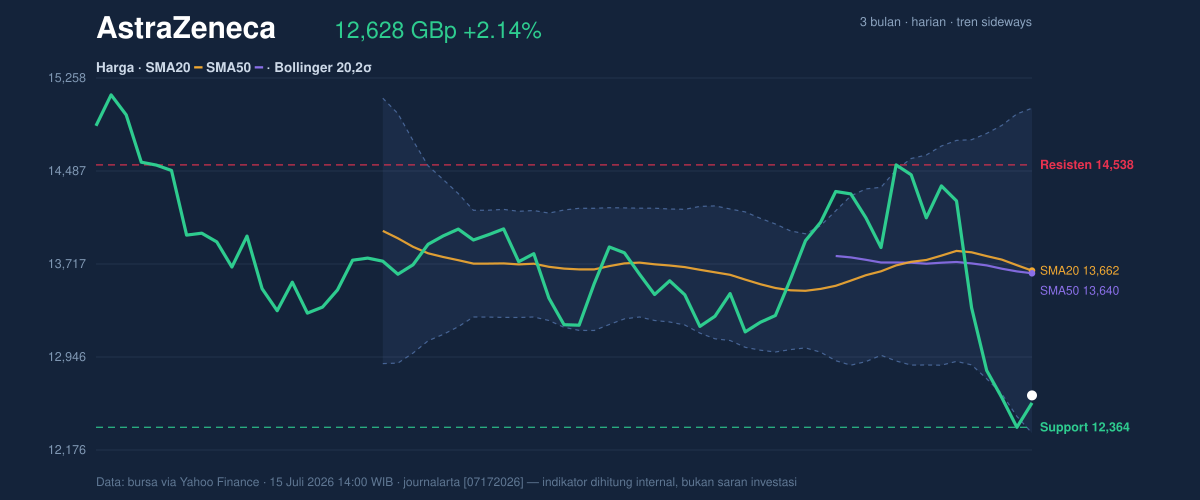
AstraZeneca (AZN.L) shares traded at 12,628.00 GBp as of the most recent session, marking a 2.14% daily recovery that provides a marginal buffer against a broader 11.32% retreat observed over the last five trading sessions. While the pharmaceutical giant has seen significant volatility, the current price action reflects an attempt to stabilize near the lower bounds of its recent trading range. Data from the London Stock Exchange confirms that while daily sentiment has shifted positive, the underlying structure remains pressured by selling momentum accumulated over the previous month.
Trend & Price Structure
The stock is currently navigating a sideways trend characterized by a downward slope of -1.18% in the 20-day Simple Moving Average (SMA). With the price resting at 12,628.00 GBp, it sits comfortably below both the SMA20 (13,661.80 GBp) and the SMA50 (13,640.00 GBp). This positioning confirms that the prevailing medium-term trend is struggling to find a catalyst for a bullish reversal. The stock is currently trading in the lowest 12% of its 20-day range, leaving the 12,364.00 GBp support level as the critical floor to watch.
Oscillators & Momentum
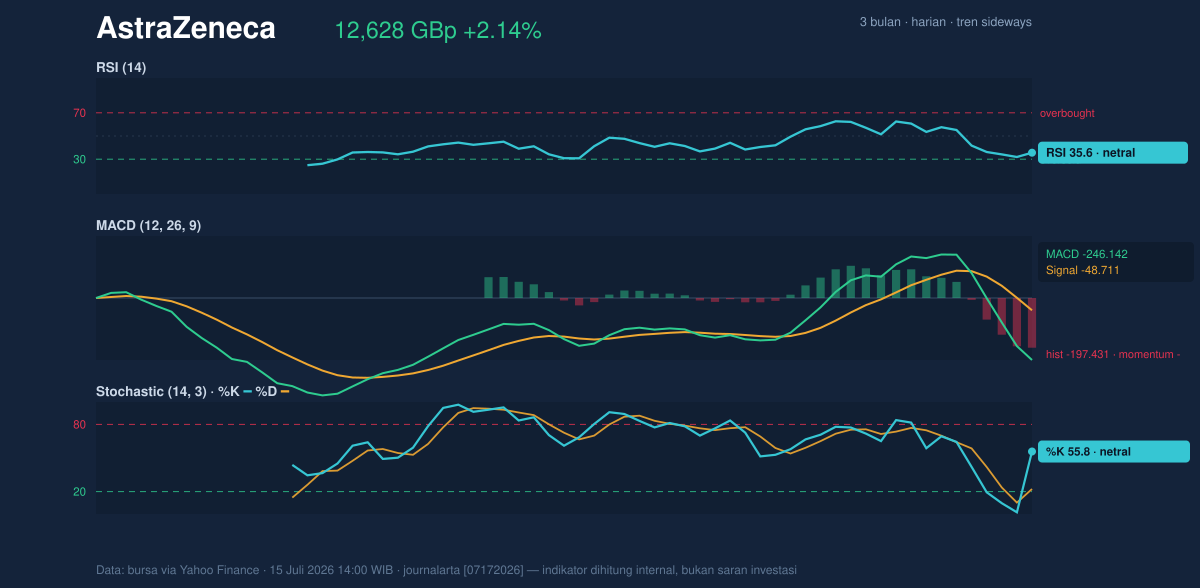
Momentum indicators highlight a divergence between short-term exhaustion and medium-term bearish pressure. The RSI (Relative Strength Index) at 35.6 suggests the stock is moving away from oversold territory but has yet to gain the strength required to challenge the neutral zone decisively. Concurrently, the Stochastic oscillator (%K 55.8 / %D 22.3) shows a narrowing gap, indicating that the recent selling pressure is beginning to wane. However, the MACD remains deep in negative territory at -246.142, with the histogram confirming that bearish momentum is still firmly in control of the trend.
Volatility & Volume
Market participation has intensified, with a volume of 3,346,168 shares—approximately 1.3 times the 20-day average—suggesting that the recent pullback triggered significant institutional repositioning. The Bollinger Bands indicate the price is currently near the lower band, which sits at 12,315.73 GBp. Given an ATR (Average True Range) of 679.29, the stock is exhibiting a high-volatility profile, representing a 5.4% movement relative to the price. This expansion indicates that the price could swing substantially before establishing a new equilibrium, particularly as the OBV (On-Balance Volume) remains in a downward trend, signaling that institutional money is not yet confirming a full-scale trend reversal.
Technical Verdict: HOLD (wait & see)
AstraZeneca is currently caught in a high-volatility environment where the price is testing critical support without the support of positive momentum convergence.
* Reasons: The price remains trapped below key moving averages, the MACD remains firmly negative, and the OBV trend suggests that institutional buying interest has yet to materialize.
* Invalidation: This hold stance is invalidated if the price decisively closes above the 13,661.80 GBp level, which would signal a shift toward the SMA median.
* Entry Range: 12,350.00 – 12,500.00 GBp.
* Exit Target (Resistance): 14,538.00 GBp.
* Stop Loss: 12,250.00 GBp.
The stock is currently testing a zone where buyers must demonstrate sustained conviction to prevent a breach of the 12,364.00 GBp support level.
Summary Data AstraZeneca
| Last price | 12,628.00 GBp |
| Change 1 day / 5 days / 1 month | 2.14% / -11.32% / -6.26% |
| Trend / MA-cross | sideways / none |
| SMA20 / SMA50 | 13,661.80 / 13,640.00 |
| RSI (14) / Stochastic %K | 35.6 / 55.8 |
| Bollinger %B / ATR | 12% / 679.29 |
| Support / Resistance 20 days | 12,364.00 / 14,538.00 |
| Data as of | 15 Juli 2026 14:00 WIB |


