HSBC Testing Key Resistance: Stock Gains 0.26% (Juli 17, 2026)
On Juli 17, 2026: price 1,493.80 GBp, trend uptrend, RSI 62.6, support 1,422.60, resistance 1,490.00. technical analysis of hsbc stock.

HSBC Holdings (HSBA.L) is navigating a period of concentrated strength, currently trading at 1,493.80 GBp as of the July 15, 2026, market session. The stock has posted a measured advance, rising 0.26% today and 3.95% over the past month, signaling a resilient climb that reflects steady institutional confidence. The current positioning suggests that investors are pricing in a constructive environment, as the stock sits firmly above its short-term moving averages.
Trend and Price Action
The technical architecture of HSBC is defined by a consistent, positive slope. With the price comfortably positioned above the SMA20 of 1,449.60 and the SMA50 of 1,395.67, the primary trend remains strictly bullish. Unlike periods of speculative volatility, this upward trajectory is supported by a steady SMA20 slope of 1.52% over five days, indicating a disciplined rather than frantic appreciation.
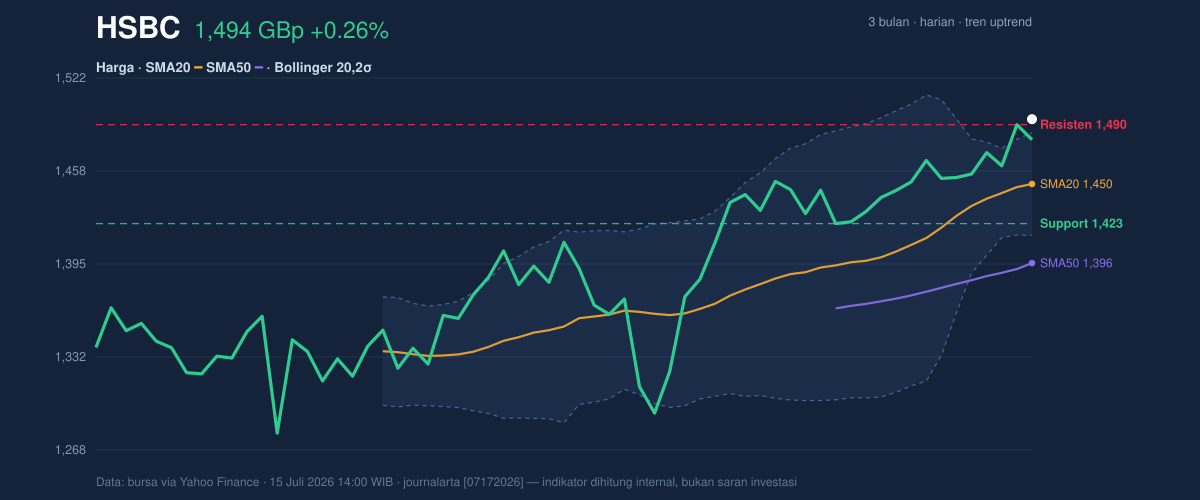
Crucially, the stock has pushed past the Bollinger upper band of 1,484.71. When a security trades above this threshold—a state currently reflected by a %B of 113%—it often serves as a signal of localized momentum exhaustion or, conversely, the start of an aggressive trend extension. Given the 4.8% bandwidth, which is undergoing a contraction or "squeeze," the market appears to be coiling for a potential volatility expansion.
Oscillators and Momentum
While the price action is bullish, the underlying momentum indicators suggest a degree of caution. The RSI(14) at 62.6 sits in neutral territory, providing enough room for further upside without signaling overbought conditions that would necessitate a sharp retracement. Meanwhile, the Stochastic %K of 39.6 and %D of 38.2 confirm that there is no immediate pressure from short-term traders to liquidate positions.
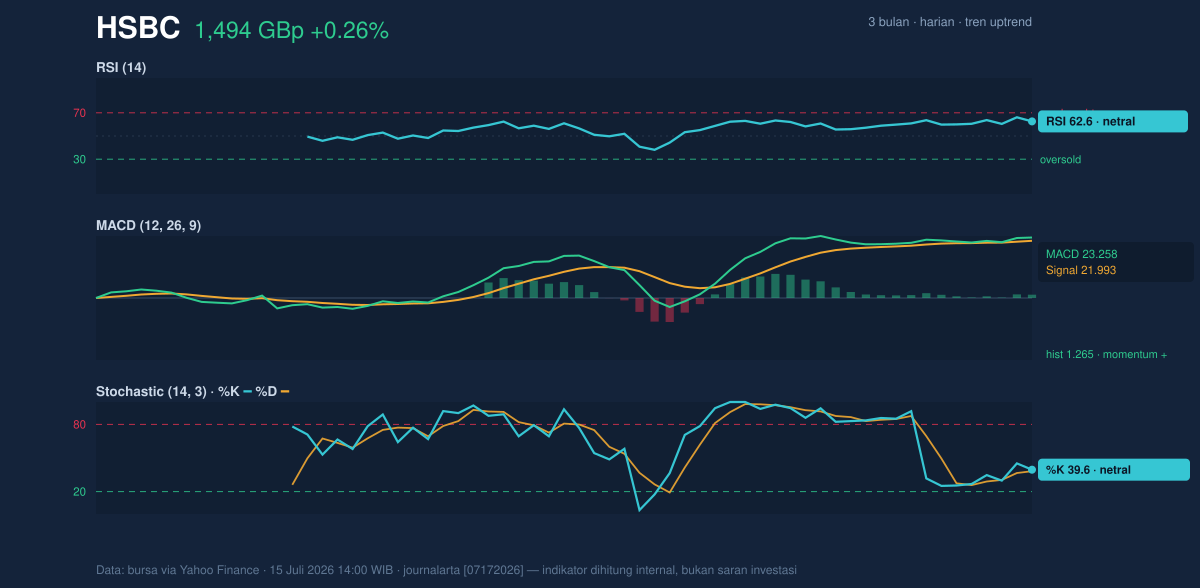
The MACD value of 23.258 remains above the signal line of 21.993, confirming that the momentum is positive. The positive histogram reading of 1.265 reinforces that the buying interest is currently outweighing selling volume, even if the pace of those gains has moderated compared to the previous quarter.
Volatility and Volume Dynamics
Market participation as measured by volume remains quiet, with the latest turnover of 20,573,215 shares tracking at 0.9x the 20-day average. In technical terms, the fact that the price is advancing on below-average volume while the OBV (On-Balance Volume) is rising suggests that "smart money" is not aggressively exiting, but rather holding their positions, awaiting the next catalyst to force a breakout above the recent resistance levels. With an ATR(14) of 35.65, representing 2.4% of the current price, the stock is experiencing moderate daily swings, suggesting that the current resistance levels are unlikely to be breached without a distinct surge in daily volume.
Technical Verdict: HOLD (wait & see)
The technical indicators present a tug-of-war between the current trend momentum and the risk of a mean-reversion move given the stock's position above the Bollinger bands.
* Positive Momentum: The MACD remains in a bullish crossover, and the stock is trading comfortably above both its 20-day and 50-day moving averages.
* Overextension Risk: The %B of 113% indicates the stock is currently trading outside its statistical "normal" range, which often leads to a temporary cooling-off period.
* Invalidation: This outlook is invalidated if the price breaks decisively below the support level of 1,422.60, which would signal a shift in the short-term trend.
Reference Parameters:
* Entry Range: 1,440.00 – 1,450.00 GBp (targeting a re-test of the SMA20)
* Exit Target (Resistance): 1,510.00 – 1,520.00 GBp
* Stop Loss: 1,410.00 GBp
For those observing the market, this implies that while the trend is positive, the current price is slightly "stretched" compared to its recent average, suggesting a preference for waiting for a minor pullback before evaluating new entries.
HSBC reported a total volume of 20,573,215 shares on July 15, 2026.
Summary Data HSBC
| Last price | 1,493.80 GBp |
| Change 1 day / 5 days / 1 month | 0.26% / 2.74% / 3.95% |
| Trend / MA-cross | uptrend / none |
| SMA20 / SMA50 | 1,449.60 / 1,395.67 |
| RSI (14) / Stochastic %K | 62.6 / 39.6 |
| Bollinger %B / ATR | 113% / 35.65 |
| Support / Resistance 20 days | 1,422.60 / 1,490.00 |
| Data as of | 15 Juli 2026 14:00 WIB |



