DBS Stock Gains 0.62% Today, RSI Overbought
On Juli 17, 2026: price 72.48 SGD, trend uptrend, RSI 85.4, support 65.40, resistance 72.98. technical analysis of dbs stock. Key angle: DBS Stock Gains.
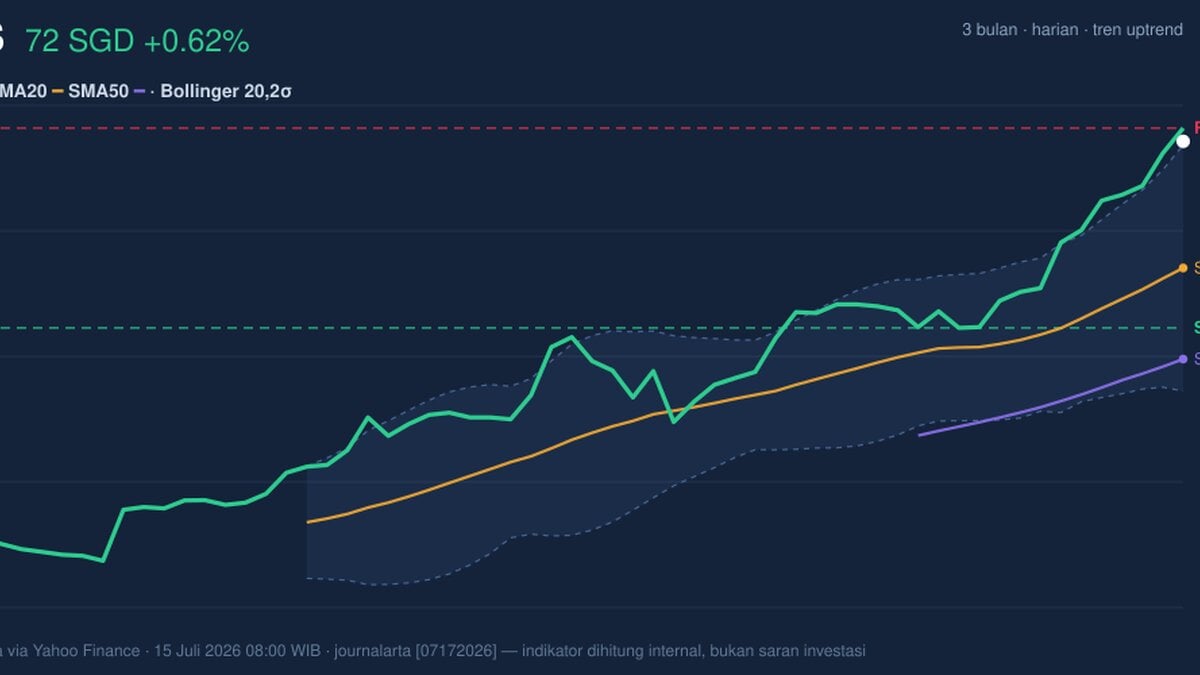
DBS Group Holdings (D05.SI) has surged to a last price of 72.48 SGD, marking a decisive move that captures the current optimism surrounding Singapore’s flagship lender. With a 1-month gain of 11.49% and a sharp 4.89% climb over the past five sessions, the stock is exhibiting significant institutional momentum. Market participants are responding to a confluence of firm banking fundamentals and a technical breakout that has left the broader market structure in its wake.
The speed of the move is the story here.
Trend and Price Action
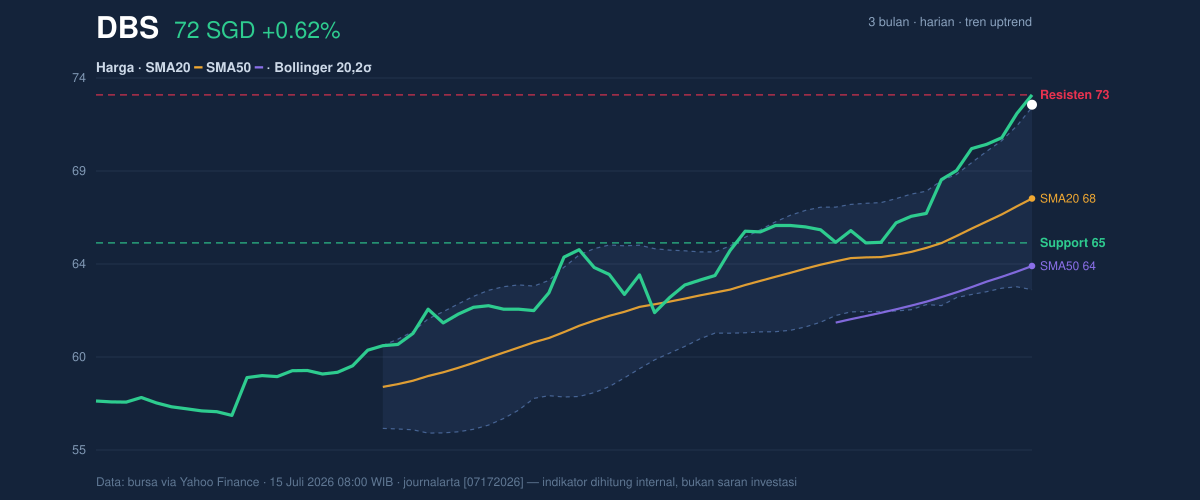
The stock is currently trading in a clear uptrend, anchored by a robust SMA20 slope of 2.92% over five days. DBS is comfortably positioned above its moving averages, with the SMA20 at 67.67 and the SMA50 at 64.22. This "stacked" configuration—where the shorter-term average sits above the long-term—is the textbook definition of a healthy bullish trend. However, the price’s relationship to the Bollinger Bands warrants caution: with %B at 101%, the stock is currently piercing the upper boundary of its volatility channel. This often signals that the recent ascent has been aggressive, potentially outpacing the stock’s historical volatility norms.
Oscillators and Momentum
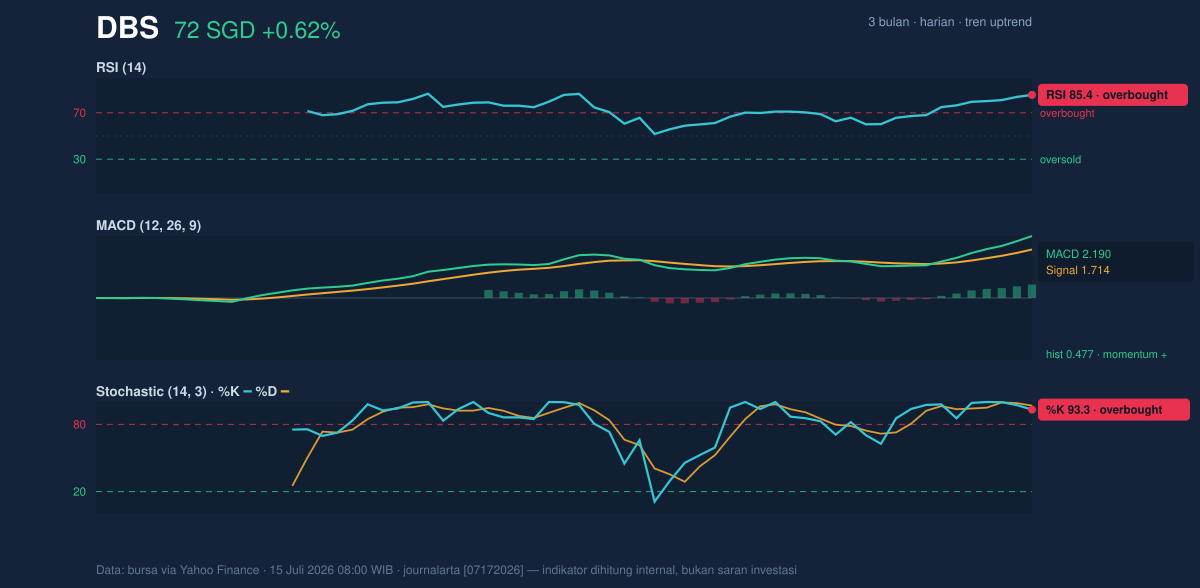
While the trend is undeniably upward, the internal momentum indicators are screaming for a breather. The RSI(14) has hit 85.4, a level firmly in overbought territory that typically precedes a period of consolidation or a cooling-off phase. Similarly, the Stochastic oscillator shows %K at 93.3 and %D at 96.8, confirming that the current buying frenzy is reaching an extreme. Yet, the MACD remains positive at 2.190, with the histogram showing a sustained gap above the signal line. This suggests that while DBS is technically overstretched, the underlying trend force is still heavily skewed toward the upside.
Volatility and Volume
Participation is high, which provides credibility to this rally. The volume of 5,988,500 sits at 1.4 times the 20-day average, indicating that the move is backed by institutional conviction rather than retail noise. The On-Balance Volume (OBV), which tracks cumulative flow, is trending upward, confirming that investors are accumulating shares even at these elevated levels. Meanwhile, the ATR(14) at 1.06 suggests that while the stock is moving, the inherent volatility remains relatively contained at roughly 1.5% of the share price, hinting that the current price action is a steady march rather than a speculative bubble.
Key Levels and Scenarios
The market is now testing the resistance level of 72.98. If the stock can pierce and hold above this 20-day high, it would clear the path toward the 3-month high of 73.55. Conversely, should the overbought indicators trigger a mean-reversion, the first natural area of interest for buyers would be the support level of 65.40. If the price fails to hold this floor, the SMA20 at 67.67 effectively becomes the "line in the sand" for traders looking to maintain the current bullish thesis.
Technical Verdict: HOLD (wait & see)
The current technical posture of DBS is characterized by a strong trend colliding with extreme exhaustion, leading to a neutral "wait and see" stance for new entries.
* Primary Reasons: The RSI of 85.4 and Stochastic levels above 93 indicate that the stock is statistically overextended, significantly increasing the probability of a short-term pullback to digest recent gains.
* Invalidation Condition: The HOLD verdict is invalidated if price breaks or sustains a close above 72.98 with continued high volume, which would signal a new leg of momentum that ignores overbought conditions.
* Ideal Entry Range: 67.00 – 68.00 SGD (targeting a retest of the SMA20).
* Exit Target: 73.50 SGD.
* Stop Loss: 64.00 SGD.
For those watching from the sidelines, the current price is a classic case of chasing a rally that is already signaling a need for a cooling period.
Summary Data DBS
| Last price | 72.48 SGD |
| Change 1 day / 5 days / 1 month | 0.62% / 4.89% / 11.49% |
| Trend / MA-cross | uptrend / none |
| SMA20 / SMA50 | 67.67 / 64.22 |
| RSI (14) / Stochastic %K | 85.4 / 93.3 |
| Bollinger %B / ATR | 101% / 1.06 |
| Support / Resistance 20 days | 65.40 / 72.98 |
| Data as of | 15 Juli 2026 08:00 WIB |
Track DBS share price daily: live levels, support/resistance and our full DBS analysis history.



