RSI Overbought, UOB Stock Drops 1.98% Today
On Juli 17, 2026: price 43.50 SGD, trend uptrend, RSI 84.1, support 39.25, resistance 44.95. technical analysis of uob stock. Key angle: RSI Overbought.

United Overseas Bank (UOB) shares retreated from recent highs on the Singapore Exchange (SGX) as of July 15, 2026, closing at 43.50 SGD, a decline of 1.98% compared to the previous session. Despite the daily dip, the bank maintains a robust structural bias, currently trading significantly above its SMA20 of 41.25 and SMA50 of 39.18. This positioning underscores a resilient uptrend, further evidenced by the SMA20 slope of 3.64% over the last five days, signaling that the bank's medium-term trajectory remains firm despite minor profit-taking.
Trend and Price Action
The current price action occupies the upper quartile of the 3-month trading range between 35.70 and 45.15. By holding at 43.50 SGD, the stock is currently positioned at 75% of its established range, indicating a strong buyer presence that has defended levels above the 41.25 midline of the Bollinger Bands. As shown in the chart below, the stock is currently testing the interior of its volatility channel, with the upper band capping potential gains at 45.29 SGD.
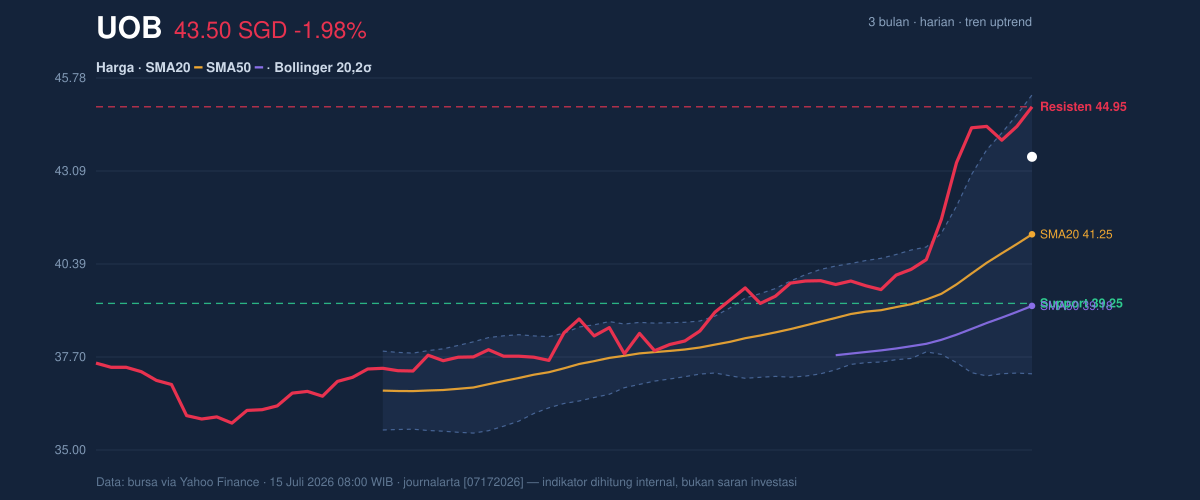
The interaction between the price and the Bollinger Bands reveals a %B of 78%, a reading that suggests the asset is neither excessively compressed nor screaming for an immediate breakout. With a band width of 19.6%, the stock is operating in a state of normal volatility, allowing for controlled price discovery without the erratic swings often associated with tighter or wider bands.
Oscillators and Momentum
While the structural trend is supportive, short-term momentum indicators are flashing warning lights that suggest a cooling-off period may be imminent. The RSI (14) stands at 84.1, well within the overbought territory, often serving as a precursor to a technical consolidation or a mean-reversion move. This is corroborated by the Stochastic oscillator at 96.5 (%K) and 93.2 (%D), reinforcing the view that the recent surge may have outpaced its own internal rhythm.
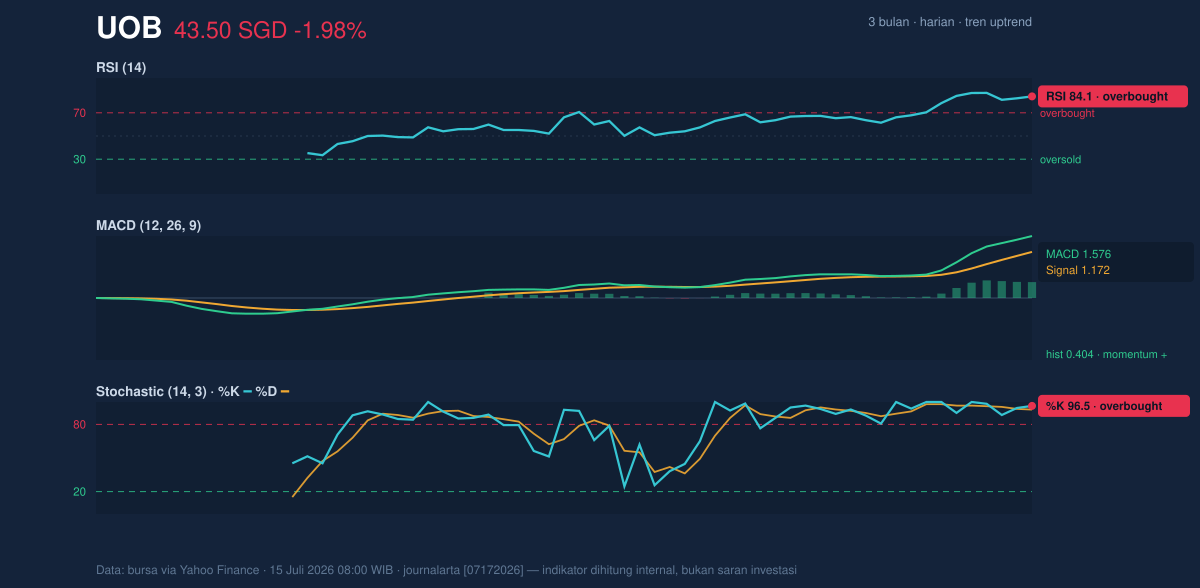
Conversely, the MACD remains positive at 1.576, with the signal line trailing at 1.172. The presence of a positive histogram at 0.404 indicates that the underlying demand remains substantial. Investors are likely weighing the 10.55% monthly gain against the exhaustion signals in the oscillators, creating a tug-of-war between strong macro momentum and overextended daily price levels.
Volatility and Volume Confirmation
Trading volume was recorded at 3,540,100 shares, roughly 1.1 times the 20-day average of 3,163,971. This elevated participation relative to the average suggests that the selling pressure seen in the latest session is being met with genuine liquidity rather than panic selling. The On-Balance Volume (OBV) continues to trend upward, which is a critical positive signal; it implies that despite the daily price drop, the cumulative volume flowing into the stock remains supportive of the primary uptrend. The ATR (14) of 0.80 indicates that volatility is manageable, representing roughly 1.8% of the share price, ensuring that moves are not yet becoming detached from historical norms.
Key Levels and Scenarios
The immediate challenge lies at the resistance level of 44.95 SGD, a point established by 20-day price history. A breakout above this, clearing the path toward the Bollinger upper bound of 45.29 SGD, would require a surge in volume to confirm a continuation of the bullish trend. Conversely, should the price fail to hold the 41.25 SGD support—the current SMA20 level—the focus would shift toward the secondary support of 39.25 SGD.
Technical Verdict: HOLD (wait & see)
* Reasoning: The stock is in an established uptrend, yet indicators are currently overextended, with the RSI and Stochastic signaling extreme overbought conditions.
* Invalidation: The bullish bias is invalidated if the price falls below the 39.25 SGD support level on high volume, suggesting a deeper retracement.
* Entry Range: 40.50 – 41.25 SGD.
* Exit Target: 44.95 – 45.29 SGD.
* Stop Loss: 38.75 SGD.
This evaluation implies that for participants currently holding positions, patience is advised to see if the stock can successfully absorb the overbought pressure and consolidate above the moving averages.
UOB is scheduled to provide further transparency regarding its performance metrics in upcoming quarterly regulatory filings.
Summary Data UOB
| Last price | 43.50 SGD |
| Change 1 day / 5 days / 1 month | -1.98% / 0.39% / 10.55% |
| Trend / MA-cross | uptrend / none |
| SMA20 / SMA50 | 41.25 / 39.18 |
| RSI (14) / Stochastic %K | 84.1 / 96.5 |
| Bollinger %B / ATR | 78% / 0.80 |
| Support / Resistance 20 days | 39.25 / 44.95 |
| Data as of | 15 Juli 2026 08:00 WIB |



